REGIONAL
CHANGES IN LIFE EXPECTANCY AND CAUSES OF DEATH IN MOLDOVA AFTER
INDEPENDENCE
Olga PENINA,
doctor in medicine, Associate Professor,
Nicolae Testemitanu State University of Medicine and Pharmacy
https://orcid.org/0000-0002-3884-2751 email: [email protected]
Received 26 January 2022
Accepted for publication 10 May 2022
ABSTRACT.
After the period of fluctuations related to the socio-economic crisis of the 1990s, life expectancy at birth in Moldova mainly stagnated until 2005 in females and 2010 in males. Recent trends show moderate improvements until the COVID-19 pandemic. The article presents regional differences in mortality in Moldova to identify the most problematic districts. Data and methods: regional data on mortality by cause were analysed for three five-year periods around 1993, 2004 and 2014. Differences in life expectancy at birth between the leading districts and the lagging districts were decomposed by age and cause of death. Results: The gradient in life expectancy was revealed between the northern districts and the municipality of Chisinau, where mortality is low, and the belt of the districts located mainly in the centre, where mortality is high. Cardiovascular and digestive diseases in both sexes, as well as external causes of death in males were responsible for the interregional mortality differentiation. Recent growth in life expectancy was accompanied by an increasing interregional differentiation of mortality from cardiovascular diseases among the elderly and external causes of death among the middle-aged. The progress was the most significant in the municipality of Chisinau, while in the rest of the country, it largely reflected the recovery from the severe socio-economic crisis of the 1990s. Conclusions: The districts falling within the red belt of high mortality have made no progress in terms of population health since independence. In this geographic area, preventive measures aimed at reducing the risk factors associated with cardiovascular disease, liver cirrhosis and external causes of death are needed.
Keywords: causes of death, life expectancy, Moldova, mortality, regional analysis
După perioada de fluctuații legate de criza socioeconomică din anii 1990, speranța de viață la naștere în Moldova a stagnat până în 2005 la femei și până în 2010 la bărbați. Tendințele recente arată o ameliorare moderată a situației până la pandemia de COVID-19. În articol sunt prezentate diferențele regionale ale mortalității în Moldova pentru a identifica cele mai problematice raioane. Date și metode: datele regionale privind mortalitatea pe cauze de deces au fost analizate pentru trei perioade de cinci ani apropiate de anii 1993, 2004 și 2014. Diferențele în speranța de viață la naștere între raioanele avansate și raioanele rămase în urmă au fost analizate din perspectiva vârstei și a cauzelor de deces. Rezultate: Diferențe în speranța de viață au fost evidențiate între raioanele nordice și municipiul Chișinău, unde mortalitatea este scăzută, și centura raioanelor situate preponderent în centru, unde mortalitatea este înaltă. Bolile cardiovasculare și ale tractului digestiv la ambele sexe, precum și cauzele externe de deces la bărbați au determinat diferențierea interregională sub aspectul mortalității. Creșterea recentă a speranței de viață a fost însoțită de o diferențiere interregională crescândă a mortalității, cauzate de bolile cardiovasculare în rândul vârstnicilor și de cauzele externe de deces în rândul persoanelor de vârstă mijlocie. Progresul cel mai semnificativ s-a înregistrat în municipiul Chișinău, în timp ce în restul țării acesta a reflectat în mare măsură redresarea de după criza socioeconomică severă din anii ”90. Concluzii: Raioanele care se încadrează în centura roșie a mortalității înalte nu au înregistrat niciun progres în ceea ce privește sănătatea populației în perioada independenței. În această zonă geografică sunt necesare măsuri de prevenție, care să vizeze reducerea factorilor de risc asociați cu bolile cardiovasculare, ciroza hepatică și cauzele externe de deces.
Cuvinte cheie: cauze de deces, speranța de viață, Moldova, analiza regională
После периода колебаний, связанных с социально-экономическим кризисом 1990-х гг., ожидаемая продолжительность жизни при рождении в Молдове в основном не регистрировала какого-либо прогресса до 2005 г. у женщин и до 2010 г. у мужчин. Последние тенденции показывают умеренное улучшение здоровья населения вплоть до пандемии COVID-19. В статье представлены региональные различия смертности в Молдове с целью определения наиболее проблемных районов. Данные и методы: региональные данные по причинам смертности были проанализированы за три пятилетних периода, прилегающих к 1993, 2004 и 2014 гг. Различия в ожидаемой продолжительности жизни при рождении между ведущими и отстающими районами были рассмотрены на основе декомпозиции по возрасту и причинам смерти. Результаты: были выявлены различия в ожидаемой продолжительности жизни между северными районами и муниципием Кишинэу, где смертность низкая, и поясом районов, расположенных в основном в центре, где смертность высокая. Сердечно-сосудистые и пищеварительные заболевания у обоих полов, а также внешние причины смерти у мужчин определяют межрегиональную дифференциацию смертности. Недавний рост продолжительности жизни сопровождался усилением межрегиональной дифференциации смертности от сердечно-сосудистых заболеваний среди пожилых людей и от внешних причин смерти среди лиц среднего возраста. Прогресс был наиболее значимым в муниципии Кишинэу, в то время как в остальной части страны он в большей степени отражал восстановление показателей после тяжелого социально-экономического кризиса ”90-х гг. Выводы: районы, попадающие в красный пояс высокой смертности, не добились какого-либо прогресса в области здоровья населения за период независимости, что вызывает необходимость профилактических мер по снижению факторов риска сердечно-сосудистых заболеваний, цирроза печени и внешних причин смерти.
Ключевые слова: причины смерти, продолжительность жизни, Молдова, региональный анализ
JEL Classification: I100
UDC: 614: 612.68+314.4+311.21:612.68(478)
INTRODUCTION
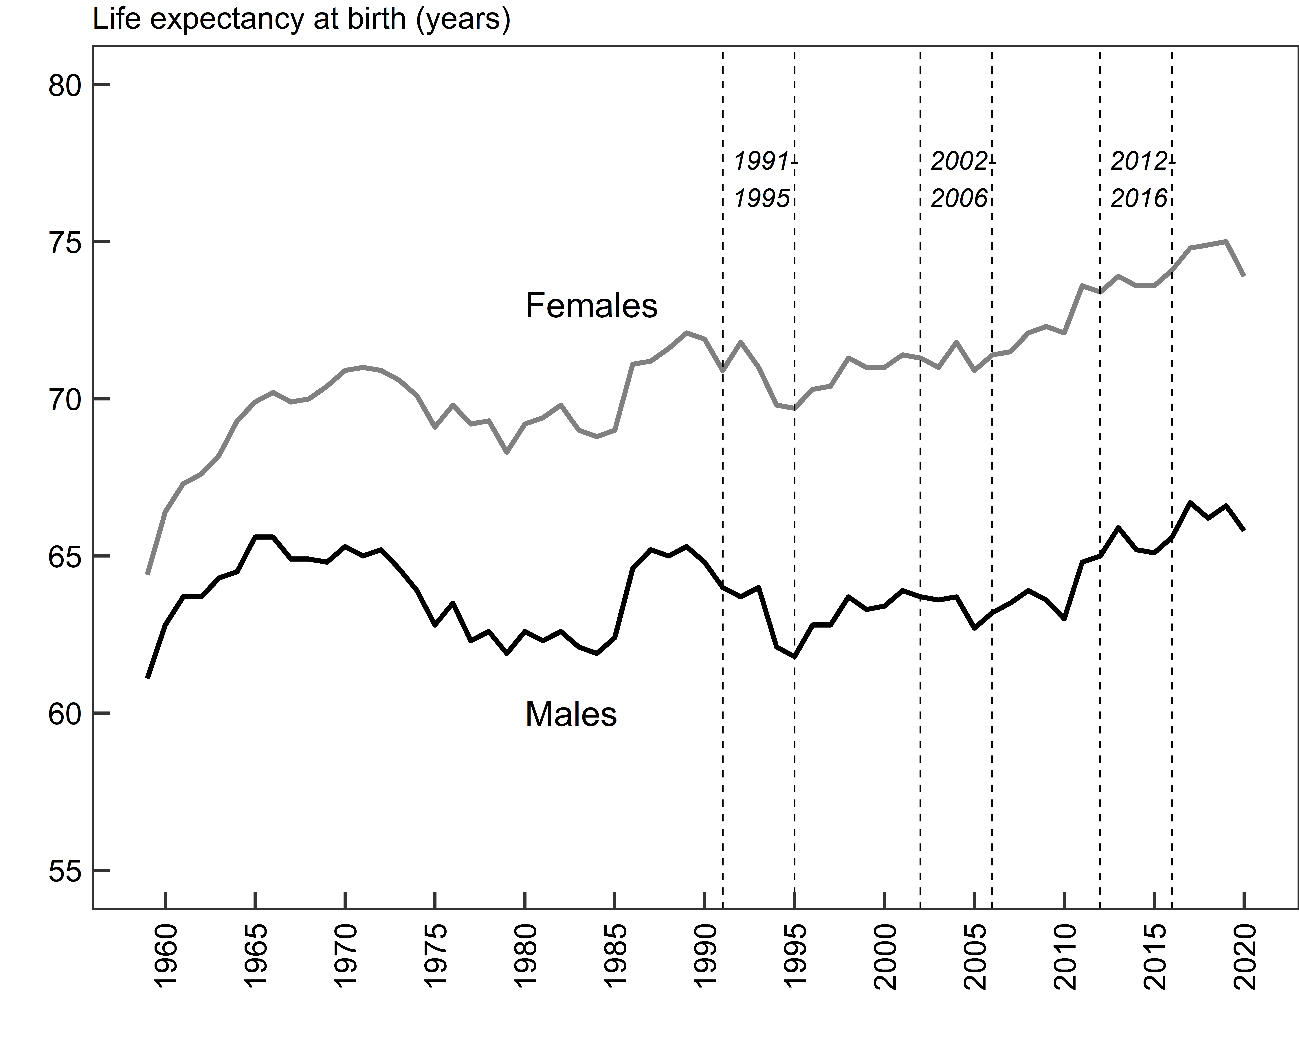
In Moldova, life expectancy has fluctuated over the past five decades without a great deal of progress, either during the Soviet period or after independence. Following rapid improvements in the early 1960s, life expectancy began to decline in both men and women. The anti-alcohol campaign initiated by the Soviets in 1985 resulted in a significant but brief increase in life expectancy in 1985-89. After proclaiming independence in 1991, the situation started to deteriorate very rapidly, with the result that in the mid-1990s life expectancy was roughly in line with the values observed before the anti-alcohol campaign. Short-term progress in life expectancy in the late 1990s did not indicate a reversal of the adverse long-term trend. Among males, the situation remained stagnant until 2010, followed by very moderate improvements. Among females, a steady life expectancy growth started in 2005 and accelerated after 2010. After 55 years of evolution, male life expectancy in 2019 (66.6 years) was just one year higher than in 1965. Female life expectancy gained 5.0 years over the same period and reached 75.0 years in 2019 (Penina et al., 2022). The COVID-19 pandemic reduced life expectancy in 2020 for both males and females by approximately 1.0 years (Gagauz et al., 2021). Previous studies on cause-specific mortality trends in Moldova showed that the long-term decline and short-term fluctuations in Moldovan life expectancy were mainly driven by three causes of death: diseases of the circulatory system and digestive system in both sexes and external causes of death in men. Recent improvements were largely due to a steady decline in mortality from cerebrovascular diseases among older females and mortality from external causes of death among young males. Further, an exceptionally high level of mortality from diseases of the digestive system with no obvious gender gap was found as a particular characteristic of the Moldovan mortality pattern (Penina, 2017).
This paper looks at the evolution of regional disparities of mortality in Moldova during the period of independence since 1991. We focus on three five-year periods, which represent the following periods in the post-independence life expectancy evolution (Fig. 1):
The period of socio-economic crisis (1991-1995) during which life expectancy declined rapidly;
The stagnation period (2002-2006) when life expectancy after a short post-crisis recovery in the late 1990s mainly stagnated for both sexes;
The period of recent improvements (2012-2016) in which life expectancy started increasing.
Figure 1.
Life expectancy at birth since the late 1950s in Moldova, by sex
Notion: the vertical lines refer to three study periods: socio-economic crisis (1991-1995), stagnation (2002-2006) and recent improvement (2012-2016).
Source: (Penina et al., 2022)
The main hypothesis of the study is that the high level of mortality in the country coexists with important regional variations in mortality, which are not constant over time. Our research questions are as follows:
How has the regional pattern of life expectancy at birth in Moldova changed during the three periods?
What causes of death and what age groups account for the interregional variation in life expectancy and how has their impact evolved?
LITERATURE REVIEW
Studies on regional differentiation of mortality, including in small areas, have always been at the centre of concerns of public health experts, as they provide valuable information for effective health policies (Denisenco, 2007). For example, the geographical diversity of mortality in Ukraine between the leading western regions and lagging eastern regions in males or south-eastern regions in females was primarily attributable to cardiovascular diseases and external causes of death (Poniakina, 2014). More recent studies on regional mortality differences in this country showed that in addition to the south, with historically low life expectancy, the north has emerged as a region with the worst situation in mortality (Levchuk and Luschik, 2019). A distinct division was found between the southwest and north-east in Russia both in terms of total mortality and cause-specific mortality patterns (Vallin et al., 2005). Interregional disparities in Belarus were mainly due to a growing advantage of the capital vis-à-vis the rest of the country (Grigoriev et al., 2013). Moreover, in Belarus, extremely high mortality rates from alcohol poisoning were found in the areas bordering Russia and Lithuania (Grigoriev et al., 2016).
The Republic of Moldova comprises three geographical regions (north, centre and south), Transnistria and the municipality of Chisinau with the capital of the same name (Fig. 2). Transnistria, located in the eastern part of the country, announced its independence in 1990, but Moldova still considers it part of its country. After proclaiming independence in 1991, Moldova adopted the Soviet territorial-administrative division, according to which the country was divided into 40 districts called “rayon”, four city soviets and six cities of republican subordination. In 1990, the names of some localities were changed or restored. In 1994, the new law on the territorial-administrative division was adopted, whereby the country consisted of 38 districts, four municipalities (Chisinau, Balti, Bender and Tiraspol) and Autonomous Territorial Unit (ATU) Gagauzia that received a special status. The administrative-territorial division was changed in 1999 when the districts were merged into bigger counties called “judet”. The country was divided into ten counties, the municipality of Chisinau, ATU Gagauzia and Transnistria. This division remained in existence until 2002 when the principle of district-based classification was reinstated. Since 2003, the administrative division consists of 32 districts, the municipalities of Chisinau and Balti, ATU Gagauzia and Transnistria. Following the return to the district-based division, two districts (Causeni and Vulcanesti) that existed before 1999 were not restored.
Figure 2.
Geographic location and territorial division of Moldova: regions and districts
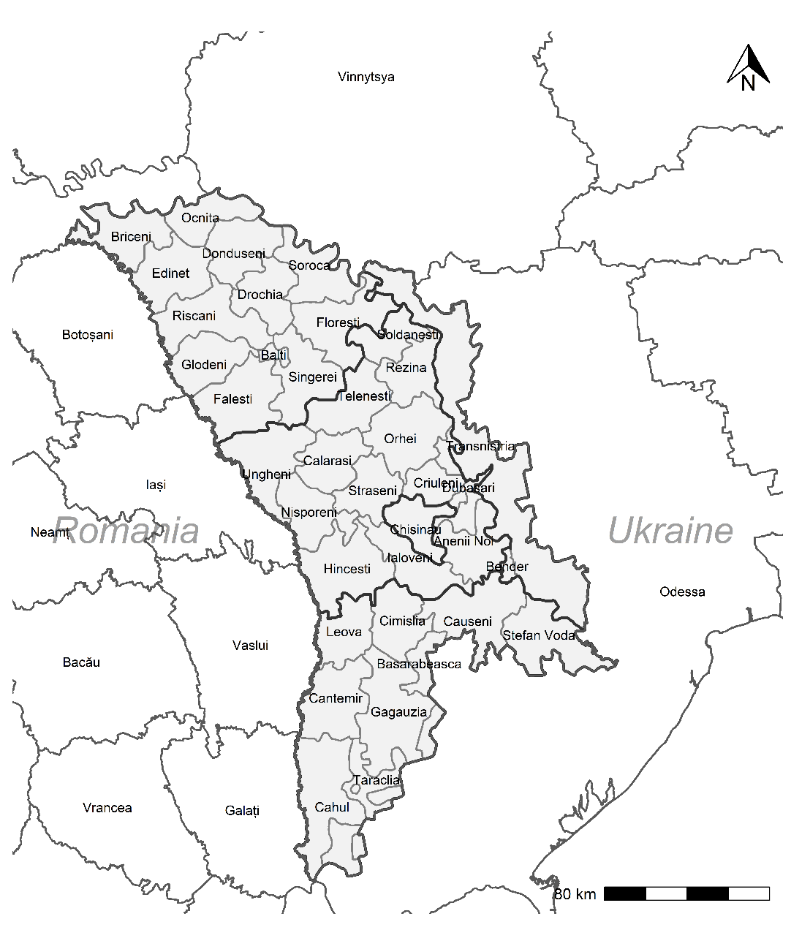
Source: based on GADM data (https://gadm.org/)
The process of depopulation that affected Moldova during the period of independence involved significant regional differences. After the last Soviet population census in 1989, Moldova carried out two population censuses in 2004 and 2014 without including Transnistria. The latter conducted two population censuses independently of Moldova in 2004 and 2015. The total population in Moldova declined from 4335 thousand in 1989 to 3799 thousand (with Transnistria) and 3243 (without Transnistria) in 2004. In 2014, Moldova’s population decreased to 3297 thousand with Transnistria and 2821 without Transnistria. According to the last census (without Transnistria), in 20 of the 35 administrative units, where 34% of Moldova’s population resides, the total population is under 70000. At the same time, 66% of the population lives in administrative units with a total population of over 70000, including the municipality of Chisinau which is home to 24% of the population. Compared to the 2004 census, the largest decrease was observed in the number of units with a total population of 100000 inhabitants and more (from eight to two). Districts in the north have the highest proportion of the older population due to lower fertility rates and longer life expectancy. At the same time, the regions of the centre and the south have a younger population structure. From an economic perspective, there is a huge difference between the municipality of Chisinau, with almost 60% of GDP, and the rest of the country (MADRM, 2020). Very few studies on regional mortality differentiation exist in Moldova. In previous studies, a mortality gradient between districts in the north, where life expectancy is higher, and districts in the Centre, where life expectancy is lower was found (Gagauz and Pahomii, 2017). Further, the central and southern regions were found more susceptible to higher premature mortality from COVID-19 infection compared to the municipality of Chisinau and northern districts (Pahomii, 2020).
DATA
AND METHODS
Data
The de-identified database of individual medical death certificates provided by the National Public Health Agency (NPHA) was used. The NPHA has been responsible for the centralised coding of causes of death since 1991 under the 9th revision of the International Classification of Diseases and Causes of Death (ICD) and since 1998 under the 10th revision of ICD. Deaths refer to the place of residence of the deceased. Since the data were available at the level of localities, it was possible to arrange it according to the current territorial division for three periods: 1991-95, 2002-06 and 2012-16. For the period 1991-95, we had to make two assumptions concerning the two districts that were not restored in 2003. First, deaths registered in the district of Cainari were attributed to the district of Causeni. Second, deaths registered in the district of Vulcanesti were attributed to ATU Gagauzia. The same assumption was made for population counts. Mortality data were aggregated based on a shortlist of causes of death presented in Table 1. For Transnistria, official statistics were available until 1997. Data on the total number of deaths by cause were collected from the Statistical Office of Transnistria for the period since 2002.
Table 1
List of causes of death used in the analysis with corresponding ICD-9 and ICD-10 codes
Cause |
ICD-9 |
ICD-10 |
Infectious diseases |
001-139 |
A00-B99 |
Neoplasms |
140-239 |
C00-D48 |
Cardiovascular diseases |
390-459 |
I00-I99 |
Respiratory diseases |
460-519 |
J00-J98 |
Digestive diseases |
520-579 |
K00-K93 |
External causes |
800-999 |
V01-Y98 |
Ill-defined causes, including senility |
780-799 |
R00-R99 |
Other causes |
240-389, 580-779 |
D50-H95, L00-Q99 |
All causes |
001-999 |
A00-Y98 |
Notion: ill-defined causes of death were redistributed between other causes of death proportionally or by a special method
Population counts, according to the 2004 and 2014 censuses were used. For the 2014 census, we used the population counts officially adjusted by the National Bureau of Statistics (NBS) due to incomplete registration. For both years, the population refers to the usually resident population, which excludes the temporary absent population (more than 12 months). For the period 1991-1995, we relied on the official annual estimates for 1993 based on the 1989 census. For Transnistria, we used the results of the population census conducted independently in 2004, while for the 2015 census, the data by age were unavailable.
The data underwent preliminary treatment prior to analysis due to an increase in mortality from ill-defined causes (780-799 under ICD-9) in the 1990s. Ill-defined deaths were almost entirely represented by the senility item (797 under ICD-9), with the share in total mortality ranging from less than 1% in the Orhei district to 35% in the Soldanesti district. To address the issue of senility mortality growth, we used the same approach as at the national level. In particular, deaths due to senility were attributed to cardiovascular disease for the age group 80 years and older and redistributed proportionally between all causes of death for the age group less than 80 years. For the periods 2002-2006 and 2012-2016, ill-defined causes of death (R00-R99 under ICD-10) made up less than 1% of the total number of deaths and were redistributed proportionally between all causes of death.
Methods
Abridged life tables were computed using the methods described by Chiang (Chiang and World Health Organization, 1979). To estimate the 95% confidence intervals for life expectancy, we used the Silcocks et al. method (Silcocks et al., 2001). Life tables were produced by sex, district and geographical region. The contribution of mortality by age and cause of death to the difference in life expectancy between the two groups of populations were computed based on the method of decomposition (Andreev and Shkolnikov, 2012).
Data were analysed in R using the packages “PHEindicatormethods” (life tables, confidence intervals) (Anderson et al., 2020) and “DemoDecomp” (decomposition of changes in life expectancy) (Riffe, 2018). Thematic maps were produced using the package “tmap” (Tennekes, 2018) and shapefiles from the GADM website (https://gadm.org/). The “Jenks” optimisation method of classification, which maximises the differences between the categories of observations was used to produce all the thematic maps.
Results
Changes in life expectancy
Table 2 provides life expectancy at birth by geographic regions over three time periods. In the 1991-1995 period, which refers to the socio-economic crisis, life expectancy was above the national average only in the municipality of Chisinau and in the northern region for both sexes. Life expectancy was close to the national level for women in Transnistria and below for other sex and regional categories. The most unfavourable situation in the early 1990s was found in the central region, where life expectancy was almost 2 years lower than the national average and 4 years lower than in the capital for both sexes. During the stagnation period, in 2002-2006, the situation remained practically unchanged in all regions and the municipality of Chisinau. The period 2012-2016 saw some improvements, particularly in the capital, where life expectancy increased by more than 3.0 years for both sexes compared to 2002-06. In other regions, the increase was smaller, amounting to approximately two years for women and one year for men. Leaving aside the municipality of Chisinau, which undoubtedly holds the leading position, recent progress has been more pronounced in the centre and the south than in the north. The northern region, which had a life expectancy similar to that of the capital in the early-1990s and at the beginning of the millennium, experienced much less growth, particularly among men. Despite the different degrees of the recent amelioration, the differentiation between the leading north and the municipality of Chisinau on the one hand and the lagging central and southern regions on the other is still evident. The central region remains the most backward.
Table 2
Life expectancy at birth and its changes by geographic regions, Moldova since 1991
Geographic region |
Life expectancy |
Changes in life expectancy |
||||
|
1991-1995 |
2002-2006 |
2012-2016 |
1991-1995 / 2002-2006 |
2002-2006 / 2012-2016 |
1991-1995 / 2012-2016 |
Males |
||||||
North |
64.2±0.4 |
64.2±0.4 |
65.0±0.5 |
0.0 |
0.8 |
0.8 |
Centre |
61.7±0.4 |
62.5±0.4 |
63.7±0.4 |
0.8 |
1.2 |
2.0 |
South |
62.3±0.5 |
62.8±0.5 |
64.1±0.6 |
0.5 |
1.3 |
1.8 |
Transnistria |
62.3±0.6 |
61.8±0.6 |
- |
-0.5 |
- |
- |
Mun. Chisinau |
65.3±0.5 |
64.8±0.5 |
68.6±0.5 |
-0.5 |
3.8 |
3.3 |
Moldova |
63.2±0.2 |
63.2±0.2 |
65.2±0.2 |
0.0 |
2.0 |
2.0 |
Females |
||||||
North |
72.0±0.4 |
72.6±0.4 |
74.3±0.4 |
0.6 |
1.7 |
2.3 |
Centre |
68.6±0.4 |
69.3±0.4 |
71.6±0.4 |
0.7 |
2.3 |
3.0 |
South |
69.6±0.5 |
70.4±0.5 |
72.5±0.5 |
0.8 |
2.1 |
2.9 |
Transnistria |
71.0±0.5 |
71.7±0.6 |
- |
0.7 |
- |
- |
Mun. Chisinau |
72.7±0.5 |
73.5±0.5 |
76.7±0.5 |
0.8 |
3.2 |
4.0 |
Moldova |
70.6±0.2 |
71.4±0.2 |
73.7±0.2 |
0.8 |
2.3 |
3.1 |
Source: calculations based on NPHA, NBS and Transnistrian statistical office data
Figures 3 and 4 illustrate the changes in the regional profile of life expectancy at birth in Moldova for males and females, respectively. The maps are based on the statistical classes common to the three periods. In this way, one can see how the geography of mortality modified while keeping track of patterns from one period to the next. A considerable transformation over 30 years can be observed. The period of socio-economic crisis in the early 1990s was marked by a distinct differentiation between the northern districts and the municipality of Chisinau, on the one hand, and the rest of the country, on the other hand. Among males, the two municipalities and the northern districts of Riscani and Drochia adjacent to the municipality of Balti were in the most advantageous position. Among females, the health situation in the northern districts of Briceni, Ocnita and Riscani was even better than in the capital. Nearly all central and southern districts had low and very low life expectancy. Even in the districts directly adjacent to the capital, the socio-economic crisis of the 1990s seriously degraded the population's health. It is especially apparent in the case of the map for females, where the capital of the country is encircled by districts with very low life expectancy values. A decade later, in 2002-2006, the situation began to improve in the north and less so in the south. At the same time, most of the central districts, Transnistria (men) and some southern districts continued to face serious health problems. The homogenisation process continued slowly and in the next decade. By 2012-2016, the picture had completely changed. The situation has improved not only in the north and the south, but also in the central districts directly adjacent to the capital, particularly in males (the districts of Ialoveni, Anenii Noi, Criuleni).
Following these transformations, a belt of high-mortality districts was formed by 2012-2016, extending from the Soldanesti district in the northeast to the Cantemir district in the southwest. These districts identified as the most lagging had a life expectancy at birth in 2012-2016 corresponding to the 1991-95 national level or lower (63.2 years) in males and under the lower limit of the 2002-2006 national life expectancy in females (71.2 years). For both sexes, the following eleven districts were the most lagging ones: Soldanesti, Rezina, Telenesti, Orhei, Calarasi, Nisporeni, Hincesti, Leova, Cimislia, Basarabeasca and Cantemir. The last four districts refer to the southern region and are directly adjacent to the central region.
Figure 3.
Regional profile of life expectancy at birth in 1991-1995, 2002-2006 and 2012-2016, Moldova, males
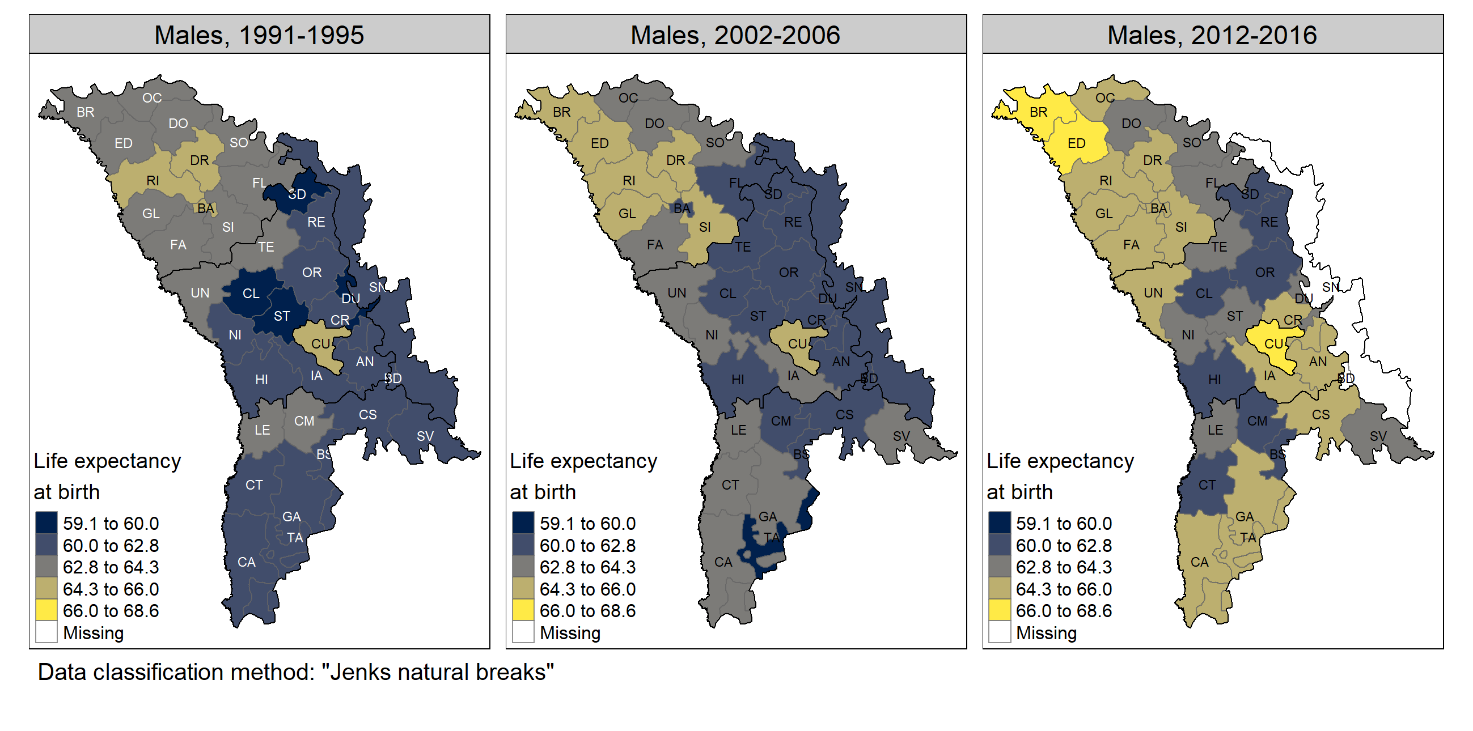
Source: calculations based on NPHA, NBS and Transnistrian statistical office data
Figure 4.
Regional profile of life expectancy at birth in 1991-1995, 2002-2006 and 2012-2016, Moldova, females
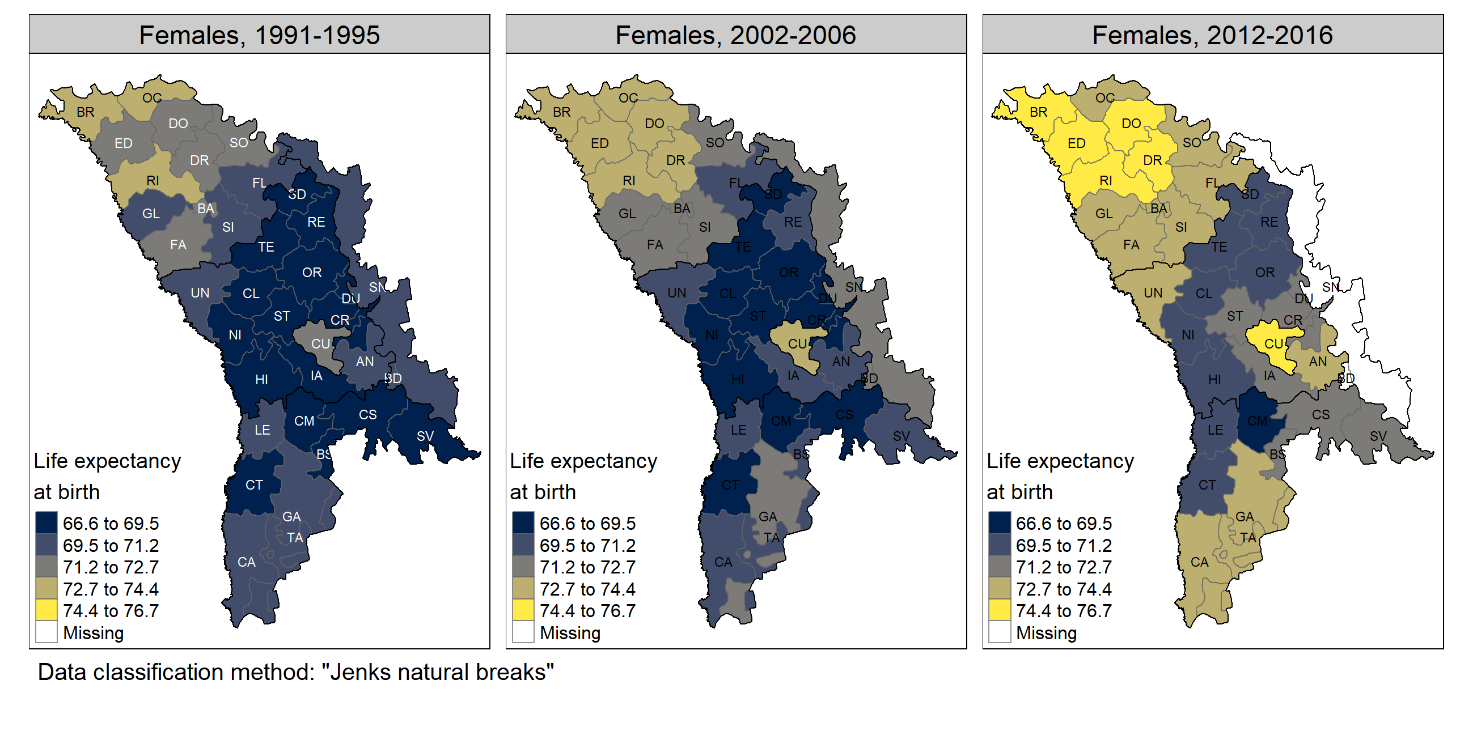
Source: calculations based on NPHA, NBS and Transnistrian statistical office data Interregional mortality differentiation
The difference in life expectancy at birth between two subgroups of the Moldovan population having the highest and lowest life expectancy was decomposed by age and cause over three study periods. The two population subgroups were represented by the 11 most backward districts and the municipality of Chisinau as the leading unit. About 20% of the population resides within each selected group, according to the 2014 census.
Among men (Fig. 5), the gap in life expectancy at birth during the crisis of the early 1990s was -3.4 years. More than 70% of this difference (-2.4 years of -3.4 years) was attributed to higher mortality at the age of 20 to 59 years in the backward districts compared to the capital. The impact of younger and older age groups was less important (-0.7 and -0.3 years, respectively). In terms of causes of death, major men’s losses in the 1990s were attributed to diseases of the respiratory system (-1.0 year), diseases of the digestive system (-0.9 year) and external causes of death (-1.0 year). Other diseases, including diseases of the circulatory system, had less impact. Diseases of the respiratory system were particularly important for infants, though the negative contribution was perceptible and for adult men. The influence of external mortality was especially significant in young men aged 20-29 years, while mature adult men suffered more from diseases of the digestive system.
Figure 5.
Contributions of mortality by age and cause to differences in life expectancy at birth between the most backward districts and the municipality of Chisinau over three periods, males
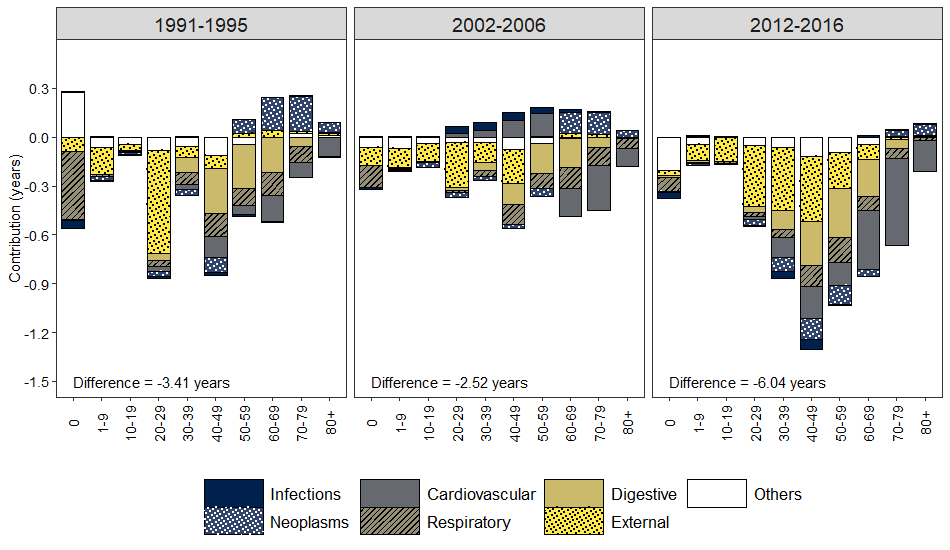
Source: calculations based on NPHA, NBS data
In the period 2002-2006, the interregional differentiation of mortality between the two male population subgroups decreased (-2.5 years). The negative contribution of infant mortality from respiratory diseases and that of adult mortality from external causes declined. No marked differences were noted in cardiovascular mortality. In the municipality of Chisinau, the situation with cardiovascular disease and infections even deteriorated. The positive contribution of cancer mortality in older men was preserved during the stagnation period due to the higher mortality in the capital than in the lagging districts. The third period was marked by a significant increase in interregional disparities in male mortality between the two subgroups. The gap in male life expectancy has doubled (-6.0 years). The main contributors were external causes of death (-1.8 years), diseases of the circulatory system (-1.6 o years) and diseases of the digestive system (-1.0 years). This period was characterised by important progress in old-age cardiovascular mortality in the capital and its absence in the lagging subgroup. The gap also started to increase due to the worsening situation with cancer mortality at working age in the lagging subgroup, while in older men the differentiation decreased.
Among women (Fig. 6), the difference in life expectancy at birth between the two analysed population subgroups was greater than among men in the first two periods (-4.2 and -4.4 years, respectively) and the same in the third period (-6.0 years).
Figure 6.
Contributions of mortality by age and cause to differences in life expectancy at birth between the most backward districts and the municipality of Chisinau over three periods, females
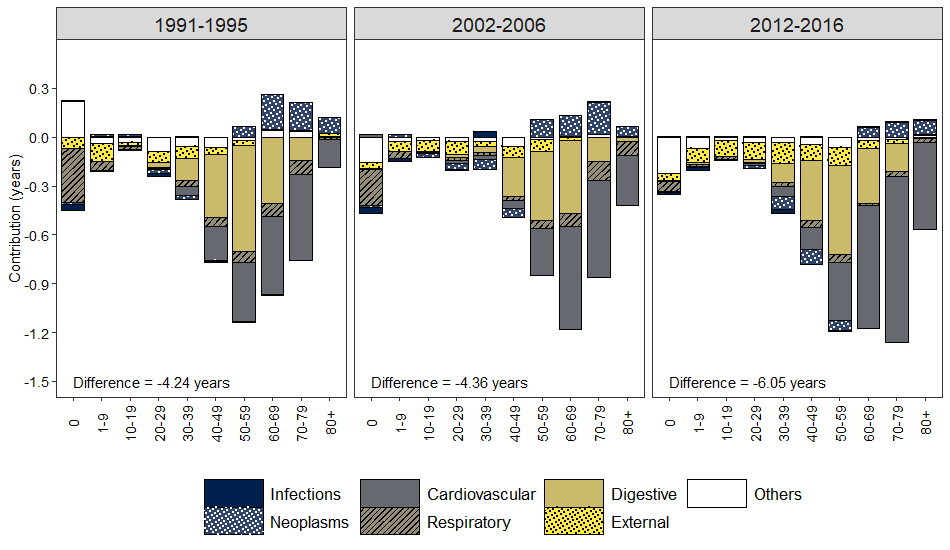
Source: calculations based on NPHA, NBS data
Unlike men, the period of stagnation among women was not characterised by an attenuation of interregional differentiation in mortality. In effect, the decomposition results for the first two periods were virtually identical. Another important difference from men was the larger impact of old-age mortality. If among males, the contributions of older age groups became apparent only during the third period, then among females, these age categories played an important role throughout the entire period, with a growing contribution of the last age group 80 years and older. Diseases of the circulatory system and diseases of the digestive system played a crucial role in the interregional differentiation of female life expectancy over the whole period of independence. These two health conditions alone were responsible for 75-80% of the life expectancy gap in females. Mature adult females from the lagging districts were more susceptible to digestive disorders than their counterparts from the capital. At the same time, the elderly women living in the municipality of Chisinau benefited from better cardiovascular mortality control. The widening gap in female life expectancy during the third period was largely explained by the increasing differentiation in cardiovascular mortality. In contrast to males, external causes were of little importance for the health of Moldovan females. Nevertheless, the negative contribution of this type of mortality increased in the last period (12% of the total difference). Women living in the municipality of Chisinau had a higher risk of dying from neoplasms in older age groups than women living in the lagging districts. Similar to males, this differentiation subsided during the third period, butbr/ the negative impact of neoplasms in working-age groups became visible.
<> DISCUSSION
The paper discusses regional changes in life expectancy and causes of death in Moldova since independence. The three five-year periods chosen reflect the evolution of life expectancy in Moldova following independence that covers the socio-economic crisis of the 1990s, the stagnation of population health during the first decade of the millennium and the recent period of improvements. The geographic diversity of the health of the Moldovan population seemed to be established before the country's independence. During the severe crisis of the 1990s, the health conditions of Moldovan men and women in the north of the country and the municipalities of Chisinau and Balti were much better than in the rest of the country. Among women, the health situation was even somewhat more favourable in some northern districts than in the municipalities. At the same time, the central and southern regions and Transnistria experienced much more health problems. The end of the socio-economic crisis and the beginning of the new millennium have not substantially improved the health of the Moldovan population, including those living in the capital. Some positive changes in overall mortality observed during the stagnation period in some districts, especially in the most backward ones, were most likely due to the temporary post-crisis recovery. Previous studies have shown that in Moldova, the short-term increase in life expectancy that occurred in the late 1990s during the continuing socio-economic crisis was attributed to the population’s adaptation to new social and economic conditions, rather than the beginning of a new sustained positive trend.
The recent increase in life expectancy in Moldova was largely due to the improvement in the health of the population living in the municipality of Chisinau and, to a lesser extent, in certain northern districts among women (Briceni, Edinet and Drochia districts). Our findings indicate that progress in life expectancy in most northern districts after independence was fairly modest. Here, the situation remained stagnant rather than improving, particularly for men. Nevertheless, with better initial positions, the situation in the north was still better than in the south or in the centre. In other districts, except for those falling into the red belt of high mortality, the progress achieved during 30 years of independence has made it possible to exceed the national average 1991-1995 or to get closer to the national average 2014-2016. Finally, in the most backward eleven districts, there has been no progress in life expectancy. Here, the health of the population remained at the same level as during the socio-economic crisis of the 1990s, if not worse.
The breakdown of the difference in life expectancy at birth between the municipality of Chisinau and the most backward districts revealed the three key causes of death that account for interregional differentiation of mortality: diseases of the circulatory system, diseases of the digestive system and the group of external causes in males. The same causes of death were responsible for the long-term negative trend in life expectancy in Moldova since the mid-1960s and its growing gap with Western countries. The municipality of Chisinau has made significant progress in life expectancy over the last decade, primarily by improving cardiovascular mortality control among the elderly. This progress was more evident in females compared to males. In a few northern districts (in particular, Drochia, Briceni districts) and the municipality of Balti, the advances in cardiovascular mortality over the period of independence were also marked. Unfortunately, there has been much less progress in other districts, where standardised cardiovascular mortality rates after deteriorating in 2002-2006 have merely returned to the 1991-1995 baseline. It is important to remember that in the early 1990s, the peak in cardiovascular mortality caused by a devastating socio-economic crisis was especially high in the country. Surely these changes cannot be viewed as genuine improvements leading to a stable increase in life expectancy growth at the national level. Regional variations in cardiovascular mortality over the past 30 years indicate enormous inequalities in population health between the capital and the rest of the country. Consequently, recent gains in life expectancy at the national level were more than modest, while the cardiovascular revolution did not reach Moldova.
Diseases of the digestive system were the second cause of death playing a key role in interregional mortality differentiation. The impact of this pathology mostly represented by cirrhosis of the liver was found highly important both in males and females, the middle-aged being the most affected age group. Earlier studies have indicated that the growth of mortality from liver cirrhosis was exceptionally rapid in Moldova in the 1970s and did not cease until the Gorbachev anti-alcohol campaign. The subsequent trend was upward or stagnant, followed by a recent moderate improvement for women. Furthermore, the male-female ratio of mortality from liver cirrhosis was found to be close to one, especially in the 1980s and 1990s, indicating indirectly the influence of the same determinant factor on both genders. The unfavourable evolution of mortality from liver cirrhosis in Moldova is closely linked to hazardous alcohol consumption. According to the WHO Global Status Report on Alcohol (WHO, 2018), Moldova was among the most consuming countries with 15.1 litres of total alcohol consumed per adult aged 15 years and older in 2016. Moldova is much closer to the wine-drinking culture, also known as the “wet” or Mediterranean culture, characterised by a high per capita alcohol consumption, lower rates of drunkenness and high levels of chronic consequences of alcohol use such as liver cirrhosis (Room and Mäkelä, 2000; Landberg, 2010). In Moldova, homemade wine consumption dominates the total unrecorded consumption (about 80% for both sexes) and represents about 30% of the total alcohol consumed (WHO, 2014).
Our results show that external causes of death have contributed to regional differentiation of all-cause mortality mostly for men and far less for women. The improvements in the municipality of Chisinau, combined with the worsening situation in the most backward districts, increase the interregional differentiation of this type of mortality and slow down the progress at the national level. Morbidity and mortality from injuries are primarily associated with the “dry” or Nordic type of drinking culture that is characteristic of many European countries of the former Soviet Union, such as Ukraine or Russia, where strong alcoholic beverages are traditionally consumed (Levchuk, 2009). The consequences of acute alcoholism, such as external causes of death, are often related to this type of drinking pattern (Rehm et al., 2003).
Mortality from neoplasms did not have a sizable impact on interregional variations in life expectancy. In comparison with the most backward districts, this type of mortality, particularly among the elderly, was higher in the municipality of Chisinau, which forwarded much further along the path of the epidemiologic transition. The increasing negative contributions of neoplasm mortality in middle-aged groups indicate the worsening status of cancer mortality in the most affected districts. This contrasts with a declining positive contribution from cancer mortality at an older age, which reflects advances in cancer treatment in the capital. The continuation of these divergent trends will accelerate interregional mortality differentiation in the future.
CONCLUSIONS
The main groups of causes of death that account for the long-term negative trend in life expectancy in Moldova are also responsible for its interregional variations. These groups include diseases of the circulatory system, diseases of the digestive system and external causes for men. There is a mortality gradient between the northern districts and the municipality of Chisinau in which life expectancy is higher and the central districts in which life expectancy is lower. The pace of progress differs from one district to another, with the fastest in the country’s capital and the lack of progress in the districts identified as the red belt of high mortality. Particular attention should be paid to the group of backward districts by public health experts.
REFERENCES
Anderson, G., Fox, S., Fryers, P., & Clegg, E. (2020). Common Public Health Statistics and their Confidence Intervals. Package “PHEindicatormethods”.https://cran.r-project.org/web/packages/PHEindicatormethods/PHEindicatormethods.pdf
Andreev, E. M., & Shkolnikov, V. M. (2012). An Excel spreadsheet for the decomposition of a difference between two values of an aggregate demographic measure by stepwise replacement running from young to old ages. MPIDR Technical Report TR-2012-002, https://doi.org/10.4054/MPIDR-TR-2012-002
Chiang, C. L. (1979). Life Table and Mortality Analysis. World Health Organization. Geneva.
Gagauz, O., Buciuceanu-Vrabie, M., Pahomii, I., Ștîrba, V., Tabac, T., & Grigoraș, E. (2021). Populația Republicii Moldova la 30 de ani de independența: provocari principale și politici necesare. Chișinău: INCE.
Gagauz, O., & Pahomii, I. (2017). Indicele Integral Teritorial de Securitate Demografică: dinamica în anii 2014-2016. UNFPA, Centru de Cercetări Demografice. policy-paper-ro.pdf
Grigoriev, P., Doblhammer-Reiter, G., & Shkolnikov, V. (2013). Trends, patterns, and determinants of regional mortality in Belarus, 1990–2007. Population Studies, 67(1), 61-81. https://doi.org/10.1080/00324728.2012.724696
Grigoriev, P., Jasilionis, D., Shkolnikov, V. M., Meslé, F., & Vallin, J. (2016). Spatial variation of male alcohol-related mortality in Belarus and Lithuania. European Journal of Public Health, 26, 1, 95-101. https://doi.org/10.1093/eurpub/ckv060
Landberg, J. (2010). Alcohol-related problems in Eastern Europe: A comparative perspective. Stockholm University. https://www.diva-portal.org/smash/get/diva2:360384/FULLTEXT01.pdf
Levchuk, N. (2009). Alcohol and mortality in Ukraine. MPIDR Working Paper, 017, 1-24. https://www.demogr.mpg.de/en/publications_databases_6118/publications_1904/mpidr_working_papers/alcohol_and_mortality_in_ukraine_3335/
Levchuk, N. M., & Luschik, L. V. (2019). Interregional Differences in Life Expectancy within Ukraine: Main Trends and Changes. Demography and social economy, 1(35), 26-40. https://doi.org/10.15407/dse2019.01.026
MADRM. (2020). Noul Concept (Paradigma) al Dezvoltării Regionale în Republica Moldova. http://adrgagauzia.md/public/files/Noul_concept_paradigm_a_dezvoltrii_regionale_in_Republica_Moldova_1.pdf
Pahomii, I. (2020). Regional aspects of COVID-19 mortality in the Republic of Moldova. In: Implicațiile economice și sociale ale pandemiei COVID-19: analize, prognoze și strategii de atenuare a consecințelor = Economic and social implications of the COVID-19 pandemic: analysis, forecasts and consequences mitigation strategies: teze ale conferinței științifice internaționale, 23 octombrie 2020, Chișinău : INCE, 2020, pp. 280 - 283.
Penina, O. (2017). Alcohol-Related Causes of Death and Drinking Patterns in Moldova as Compared to Russia and Ukraine. European Journal of Population, 33, 679-700. https://doi.org/10.1007/s10680-017-9450-4
Penina, O. (2021). Spatial disparities in mortality by causes of death in the Republic of Moldova. Moldovan Medical Journal, 64, 55-61. https://doi.org/10/18191
Penina, O., Meslé, F., & Vallin, J. (2022). Mortality trends by causes of death in the Republic of Moldova, 1965-2020. Chisinau: Tipografia CEP Medicina.
Poniakina, S. (2014). Causes and evolution of mortality disparities accross regions in Ukraine. Université Paris I- Panthéon Sorbonne.
Rehm, J., Gmel, G., Sempos, C. T., & Trevisan, M. (2003). Alcohol-related morbidity and mortality. Alcohol Res Health, 27(1), 39-51. https://pubmed.ncbi.nlm.nih.gov/15301399/
Riffe, T. (2018). Decompose Demographic Functions. Package “DemoDecomp”. https://cran.r-project.org/web/packages/DemoDecomp/DemoDecomp.pdf
Room, R., & Mäkelä, K. (2000). Typologies of the cultural position of drinking. Journal of Studies on Alcohol, 61(3), 475-483. https://doi.org/10.15288/jsa.2000.61.475
Silcocks, P. B., Jenner, D. A., & Reza, R. (2001). Life expectancy as a summary of mortality in a population: statistical considerations and suitability for use by health authorities. Journal Epidemiol Community Health, 55, 38-43. https://doi.org/10.1136/jech.55.1.38
Tennekes, M. (2018). tmap: Thematic Maps in R. Journal of Statistical Software, 84(6), 1-39. https://doi.org/10.18637/jss.v084.i06
Vallin, J., Andreev, E., Meslé, F., & Shkolnikov, V. (2005). Geographical diversity of cause-of-death patterns and trends in Russia. Demographic Research, 12, 323-380. https://doi.org/10.4054/DemRes.2005.12.13
WHO. (2018). Global status report on alcohol and health 2018.
WHO. (2014). Prevalence of noncommunicable disease risk factors in the Republic of Moldova, STEPS 2013. WHO Regional Office for Europe. Copenhagen
Денисенко, М. Б. (2007). Вопросы изучения смертности и здоровья населения малых территорий [Issues of studying mortality and health of the population of small territories]. В: М. Б. Денисенко, & Г. Ш. Бахметовой (Ред.), Смертность населения тенденции, методы изучения, прогнозы. Москва: МАКС Пресс, pp. 1-26.