THE FIRST AND SECOND DEMOGRAPHIC DIVIDENDS IN MOLDOVA
Alexandru Fala,
Program Director, Independent Think Tank „Expert-Grup”
ORCID ID: https://orcid.org/0000-0003-4204-9286
e-mail: [email protected]
DOI: https://doi.org/10.36004/nier.es.2022.2-02
JEL Classification: A 19, N3, J10, J19.
CZU: 314.174(478)
Received 26 August 2022
Accepted for publication 14 November 2022
ACKNOWLEDGEMENTS
This article is based on the study "Analysis of demographic dividends of the Republic of Moldova" (https://www.expert-grup.org/ro/biblioteca/item/2336-analiza-dividendelor-demografice-ale-republicii-moldova) written by Alexandru Fala (Independent Think Tank "Expert-Group") within the project "More opportunities: Gender-sensitive family policies for the private sector in the Western Balkans and the Republic of Moldova" implemented by UNFPA with the support of the Austrian Development Agency and in partnership with Ministry of Labour and Social Protection.
ABSTRACT
Moldova is going through a phase of intense demographic changes and is facing two major challenges: population decline and ageing, which significantly influence economic growth opportunities. The economic burden increase on the working-age population is one of the main concerns associated with demographic ageing. In this context, studying the impact of demographic changes on economic dynamics is of interest to academia and policymakers. Relatively new theoretical approaches −the first and the second demographic dividend concepts and the "economic life cycle" theory were used. The papers of foreign and domestic scientists acted as the theoretical information base of the study.
This article presents the results of a study evaluating the demographic dividend for Moldova based on National Transfer Accounts and the demographic forecast for 2022-2040. The scientific papers of foreign and Moldovan researchers were used as the theoretical and informational basis for this study. To determine the demographic dividends, the methodology proposed by Mason and Lee was used; the calculations of demographic coefficients, the assessment of the age structure and its dynamics, and the formation of demographic dividends were carried out. The results of the study showed that Moldova still needs to catch the first demographic dividend. In the next two decades, the number of producers will decrease faster than the number of consumers. Favourable market changes in the demographic structure are practically exhausted, and Moldova is entering a period of depopulation. The evolution of the demographic dividend in Moldova is in line with regional trends. However, with an active policy to increase the population's economic activity and improve living standards, there is an opportunity to reap the benefits created by the second demographic dividend. In addition, it is necessary to diversify the investment opportunities for savings, which would contribute to the accumulation of assets and indirectly increase the fixed capital.
Keywords: economic life-cycle, first demographic dividend, second demographic dividend
Moldova trece printr-o fază de schimbări demografice intense confruntându-se cu două provocări majore: scăderea și îmbătrânirea populației, având un impact semnificativ asupra oportunităților de creștere economică. Creșterea poverii economice asupra populației în vârstă de muncă este una dintre principalele preocupări asociate cu creșterea ponderii vârstnicilor în totalul populației. În acest context, studiul privind estimarea impactului schimbărilor demografice asupra dinamicii economice prezintă un interes deosebit atât pentru mediul academic, cât și pentru dezvoltatorii de politici.
Acest articol prezintă rezultatele unui studiu de evaluare a dividendului demografic pentru Moldova pe baza Conturilor Naționale de Transferuri și a previziunilor demografice pentru anii 2022-2040. Lucrările fundamentale ale oamenilor de știință străini și autohtoni au servit ca bază teoretică și informațională pentru acest studiu. Pentru a evalua acest impact, a fost utilizată o abordare teoretică relativ nouă, bazată pe conceptele primului și celui de-al doilea dividend demografic, care, la rândul lor, se bazează pe teoria „ciclului economic de viață”. Pentru determinarea dividendului demografic s-a folosit metodologia propusă de Mason și Lee; s-au efectuat calculele coeficienților demografici de estimare a structurii populației pe vârstă, a dinamicii acesteia, precum și a formării dividendelor demografice.
Rezultatele studiului au arătat că Moldova a ratat primul dividend demografic. În următoarele două decenii, numărul producătorilor va scădea mai repede decât numărul consumatorilor. Schimbările favorabile în structura demografică sunt practic epuizate, iar Moldova intră într-o perioadă de depopulare. Utilizarea ”ferestrei demografice” în Moldova corespunde tendințelor la nivel regional. Cu toate acestea, o politică activă de creștere a activității economice a populației și de îmbunătățire a nivelului de trai, ar oferi posibilitatea de a beneficia de cel de-al doilea dividend demografic. În plus, este necesară diversificarea oportunităților de investiții pentru economii, ceea ce ar contribui la acumularea de active și la creșterea indirectă a capitalului fix.
Cuvinte cheie: ciclul economic de viață, primul dividend demografic, al doilea dividend demografic
Молдова проходит через фазу интенсивных демографических изменений и сталкивается с двумя основными проблемами: сокращением и старением населения, оказывающими существенное влияние на возможности экономического роста. Увеличение экономической нагрузки на трудоспособное население, – одно из главных опасений, связанных с увеличением доли пожилых в общей численности населения. В этом контексте изучение влияния демографических изменений на экономическую динамику актуально как для академической среды, так и для политиков. В качестве теоретической и информационной базы исследования выступили фундаментальные труды зарубежных и отечественных ученых. Для оценки этого воздействия был использован относительно новый теоретический подход, основанный на идее первого и второго демографическoгo дивидендa, который, в свою очередь, основан на идее «экономического жизненного цикла».
В данной статье представлены результаты исследования по оценке демографического дивиденда для Молдовы на основе национальных трансфертных счетов и демографического прогноза на 2022-2040 годы. Теоретической и информационной основой данного исследования послужили фундаментальные труды зарубежных и молдавских ученых. Для определения демографических дивидендов использовалась методология, предложенная Мейсоном и Ли, а также были проведены расчеты демографических коэффициентов, используемых при оценке возрастной структуры, ее динамики и формирования демографических дивидендов.
Результаты исследования показали, что Молдова уже упустила первый демографический дивиденд. В ближайшие два десятилетия количество производителей будет уменьшаться быстрее, чем количество потребителей. Благоприятные конъюнктурные изменения демографической структуры практически исчерпаны и Молдовы вступает в период депопуляции. Эволюция демографических дивидендов в Молдове соответствует региональным тенденциям. Однако, при проведении активной политики по повышению экономической активности населения и повышению уровня жизни существует возможность получения выгод, создаваемых вторым демографическим дивидендом. Кроме того, необходимо диверсифицировать возможности инвестирования сбережений, что способствовало бы накоплению активов и косвенно увеличило бы основной капитал.
Ключевые слова: экономический жизненный цикл, первый демографический дивиденд, второй демографический дивиденд
INTRODUCTION
The demographic situation in Moldova is changing rapidly. The population shrinks due to the natural decrease and high emigration rates, especially among working-age people. The forecasts show that the demographic decline will continue in the following decades. Moldova's population was 2.6 million at the beginning of 2022 and could drop to 2 million in 2040 (Gagauz et al., 2021). The deepening of demographic aging accompanies population decline. During 2014 and 2021, the proportion of people aged 0–14 in the total population fluctuated around 18%, while the share of those over 65 increased from 10.9% to 14.9%. This trend will intensify over the next two decades (the small number of births will not be able to compensate for the decline of the population). Consequently, by 2040, children will represent only 1/8 of the population, while the share of older people will increase to 24.4%.
Demographic dividends show the influence of changes in the population's age structure on economic growth. The first demographic dividend results from the increase in the working-age population and ends when the proportion of working-age people shrinks as a consequence of the population ageing. Population ageing brings opportunities and opens a window for a second demographic dividend. Persons gather assets (wealth) during the active period of life to ensure consumption at old ages. In turn, accumulated assets can have a positive effect on economic growth. To evaluate the impact of demographic changes on the Moldovan economy, the two demographic dividends have been analysed.
In Moldova, the demographic dividends have been studied by Lupușor, Popa, and Prohnițchi (Lupușor et al., 2017). However, several recent changes have occurred in the national statistical system. A new methodology was used to calculate the GDP, which led to changes in the statistical data of the national output. The demographic statistic was adjusted to the results of the 2014 census. In addition, since 2014, the concept of the usually resident population began to be used to estimate other demographic indicators.
This paper aims to update the calculations of demographic dividends for Moldova taking into account the recent statistical adjustments and, hence, formulate relevant policy recommendations.
LITERATURE REVIEW
Shifts in the population's age structure create changes in the ratio between producers and consumers. During the demographic transition, fertility and mortality rates decline, and the labour force temporarily grows more rapidly than the population dependent on it, freeing up resources for investment in economic development and family welfare (Lee & Mason, 2006). Consequently, the demographic change first led to a demographic" dividend" − an opportunity for growth of output per capita.
The first demographic dividend period is quite long, lasting five decades or more. Still, eventually, lower fertility reduces the growth rate of the labour force, while continuous improvements in old-age mortality speed up the growth of the elderly population (Lee & Mason, 2006). As a result, per capita income grows slower, and the first demographic dividend becomes negative.
The same demographic forces that produce an end to the first dividend may lead to a second demographic dividend. A critical economic challenge for ageing populations is to provide consumption for older persons who typically have substantially reduced labour income (Mason, 2005). One way to meet this challenge is to increase savings and accumulate assets or physical capital, consequently improving economic growth prospects.
The first dividend yields a transitory bonus, and the second transforms that bonus into more significant assets and sustainable development. These outcomes are not automatic but depend on the implementation of effective policies. Thus, the dividend period is a "window of opportunity" rather than a guarantee of improved living standards (Lee & Mason, 2006). Realising the first demographic dividend depends on the ability of the economy to create jobs for the growing working-age population, the quality of state institutions, the level of financial market development, the state's macroeconomic policy, education policy, and other factors. Thus, the productivity of young workers depends on the policy of providing work opportunities for young parents; the productivity of older workers depends on their level of health, tax incentives, the structure of the pension system, and the state's pension policy in general.
Although the demographic dividends are sequential, they overlap. Initially, the first demographic dividend occurs and lasts for a long time. The second demographic dividend begins when the effects of the first demographic dividend are exhausted.,
Based on Asian countries' analysis, the concept of "the third demographic dividend" or "the silver demographic dividend" was developed. The "third demographic dividend" is generated by the use of the unexploited work capacity of elderly people who have a satisfactory state of health (Ogawa et al., 2021). Mason, Lee, Abrigo, and Lee (Mason et al., 2017) estimated demographic dividends for 166 countries. Mason (Mason, 2005) analysed demographic transition and demographic dividends for both: developed and developing states.
In the article, the analysis of demographic dividends is carried out starting from the concept of the "economic life cycle" (Ando & Modigliani, 1963). Typically, young and older people are less productive and consume less than they produce; as a result, the life-cycle deficit appears (Mason, 2005). Working-age adults usually present an opposite model: they generate surpluses in the life cycle, being more productive and consuming less. The surpluses generated by adults are used, directly or indirectly (through some institutions), to finance the deficits of others: children and the elderly. In practice, the life cycle consists of two profiles: producers, who obtain labour income (including the earnings of self-employed workers), and consumers.
Consumption includes both private and public consumption. Generally, a person is either a net consumer – children or the older person whose labour income is less than consumption, or a net producer – an adult of working age whose labour income exceeds consumption. National Transfer Accounts (NTA) quantify the economic life cycle and allows estimating the labour income and consumption specific to people of each age group. The surplus or deficit of a particular age group is determined by subtracting consumption from the labour income of that age group (UN, 2013).
DATA SOURCES AND METHODS
The demographic dividends have been calculated using the methodology proposed by Mason, Lee, Abrigo, and Lee (Mason et al., 2017) and Mason (Mason, 2005).
The information on population by age group for the 2014-2021 period was retrieved from the National Bureau of Statistics (NBS). The population projection for 2022-2040 of the Centre for Demographic Research (CDR) of the National Institute for Economic Research was used. The demographic dividend calculations are based on the low scenario as the most possible (Gagauz, 2020:90).
The data on labour income and consumption expenses specific to each age group was calculated by Prohnițchi V. in a project aimed at estimating NTA (Prohnițchi, 2020). The base year for estimation was 2018.
Two terms have been used to make calculations: workers/producers and consumers. The effective number of workers in the year t, noted by L(t), is calculated as follows:
 (1)
(1)
ӯl(x)=yl(x,b)/ yl(30-49,b) (2)
Where:
ω - the maximum number of lived years;
P(x,t) - population of age group x in the year t;
ӯl(x) - labour income of population from age group x;
yl(x,b) - labor income of population from age group x, for a base year b;
yl (30-49,b) – average labour income of 30–49 years aged population in the base year b.
The same approach has been used to estimate the effective number of consumers for year t, noted by N(t):
 (3)
(3)
 (x)=c(x,b)/c(30-49,b)
(4)
(x)=c(x,b)/c(30-49,b)
(4)
Where:
-
(x)
- consumption
of population from age group
x;
c(x,b) – consumption of population from age group x, for a base year b ;
c(30-49,b) – average consumption of 30 - 49 years aged population in the base year b.
The support ratio for year t, noted by SR(t), is estimated by dividing effective workers and consumers in year t:
 (5)
(5)
The growth rate of the support ratio represents the first demographic dividend.
Additional calculations are needed to determine the second demographic dividend. There will be added two new indicators: the number of effective years of labour and the number of effective years of consumption over the remaining lifetime. For a cohort aged z in year t, the number of effective years of work in the remaining lifetime, denoted by WL(z,t), and the number of effective years of consumption in the remaining lifetime, denoted by WN(z, t), are calculated according to the following formulas:
 (6)
(6)
 (7)
(7)
Where D(x-z) is a discount factor and is calculated according to the following formula:
D(x-z)=[(1+ρ)/(1+r)]x-z (8)
where ρ is the productivity's growth rate, and r is the discount rate. Both the growth rate of productivity and the discount rate is assumed to be constant. The productivity growth rate was set at 3%. This assumption was based on the fact that GDP increased on average by 3% between 2010 and 2021. We believe that this trend will be maintained in the long term, and the dynamics of GDP are close to the evolution of productivity. The discount rate was set at 5%. This assumption is based on the fact that the National Bank of Moldova has an inflation target of 5%. Between 2010 and 2021, the inflation rate fluctuated around 5%. Also, in the long term, we anticipate that the price level will increase with rates close to 5% despite the "jump" of inflation in 2022 and 2023. The National Bank of Moldova forecasts that inflation will reach 29.5% in 2022 and 15.7% in 2023 (NBM, 2022). It should be noted that inflation reflects how the prices of goods rise, which allows us to assess the future value of money. As a result, the inflation rate can be considered a discount rate.
Further, the longitudinal support rate for people aged 45 and over is calculated. Thus, in the year t, the rate of longitudinal support for people aged 45 and over, denoted by LSR 45 (t), is determined according to the following formula:
 (9)
(9)
The LSR is calculated for the remaining lifetime to compare the expected period of labour with the expected consumption period specific to a particular age cohort. The LSR depends on the amount people at each age consume and produce through their labour and how long people live (Mason, et al., 2017:9). Other things equal, the LSR will be lower if people live longer (Mason et al., 2017:9).
The LSR for people aged 45 and over is relevant in analysing how the consumption needs of retired persons are covered. The longitudinal support ratio for young adults is sufficiently high that they produce more over their expected remaining lifetime than they consume (Mason et al., 2017:27-28). Depending on the particular characteristics of each country, a critical shift occurs when people reach their 40s or, less frequently, their 50s (Mason et al., 2017:28). At this point, and their future labour income is no longer sufficient to support their prospective consumption ( Mason et al., 2017:28). Thus, the inflection point is somewhere between 40 and 50 years. For this reason, the longitudinal support rate is used for people 45 years old and over.
The next step is calculating the present value of future income and consumption. The following formulas have been used:
PVYl(z,t)= yi(30-49,t)WL(z,t) (10)
PVC(z,t)= c(30-49,t)WN(z,t) (11)
yi(30-49,t)= yi(30-49,b)(1+ρ)t-b (12)
c(30-49,t)= c(30-49,b)(1+ρ)t-b (13)
Where:
PVYl(z,t) –present value of the future labour income for the age cohort z in the year t;
PVC(z,t) –present value of the future consumption for the age cohort z in the year t;
yl (30-49,b) - average labour income of 30 - 49 years aged population in the base year b;
c (30-49,t) – average consumption of 30 - 49 years aged population in the base year b.
The wealth of the population of age z in the year t, noted by W(z, t), is calculated as the difference between the present value of consumption and the current value of labour income :
W(z,t)= PVC(z,t)-PVYl(z,t)=c(30-49,t)WN(z,t)-yi(30-49,t)WL(z,t) (14)
The wealth determined according to formula 14 represents that part of consumption that is not covered by labour income and must be financed from other sources. Pension wealth, denoted by W45, is the difference between the present value of consumption and the present value of labour income for people aged 45 and over. Pension wealth is used to show the value of assets needed to cover older people's consumption. Pension wealth is calculated according to the following relationship:
 (15)
(15)
The pension wealth includes not only pension income, which can be paid from private funds or public sources, but also the value of assets held, as well as earnings from net private transfers or other net transfers from the government. Pension wealth is a broad concept that encompasses the value of assets held and net transfers from the public sector and families for people aged 45 and over.
We adopt the hypothesis that the rate of capital growth (gr[K]) is close to the rate of change in pension wealth (gr[W45]):
gr[K]≈gr[W45] (16)
The above-mentioned assumption can be found in the study of Mason, Lee, Abrigo, and Lee (2017). Mason (2005) argues that if the share of wealth transferred to other generations remains constant over time, capital stock and the increase in wealth are equal.
Finally, it is necessary to represent the relationship between production per worker (Y/L) and capital per labour income (K/Yl). Mason (2005) argued that there is a directly proportional relationship between the rate of growth of production per worker (gr[Y/L]) and the rate of growth of capital per labour income (gr[K/Yl]):
 (17)
(17)
In turn, the total income from work for a year t (Yl (t)) is calculated according to the following relation:
Yl(x,t)=yl(30-49,b)(1+ρ)t-bL(x,t) (18)
 (19)
(19)
Some changes are made in formula 17. Thus, a coefficient of 0.5 is introduced before the ratio between capital and labour income (K/Yl). This approach was used by Mason (2005) and by Mason, Lee, Abrigo, and Lee (2017). Also, the capital stock is replaced by pensioners' wealth, and consequently, we have the following formula:
 (20)
(20)
Based on the last mathematical relationships, the second demographic dividend is calculated and represents half of the ratio's growth rate between pensioners' wealth and income from work.
According to the NTA analysis, young people until 15 years do not earn labour income in Moldova. Labour income increases between the ages of 15-34, while the highest is obtained at the age of 34. After 34 years, labour income starts to decrease.
Consumption increases rapidly from birth, peaks at the age of 20, and then declines slower until the end of life. As a result, people between 29 and 50 years have a life cycle surplus, which means that labour income is higher than consumption only for 21 years of life (Figure 1). The highest surplus is achieved at the age of 38 years and is estimated at 15,293 thousand MDL (≈ 809 USD) per person. The highest deficit, worth 69 thousand MDL (≈ 3650 USD), is registered at the age of 16 years.
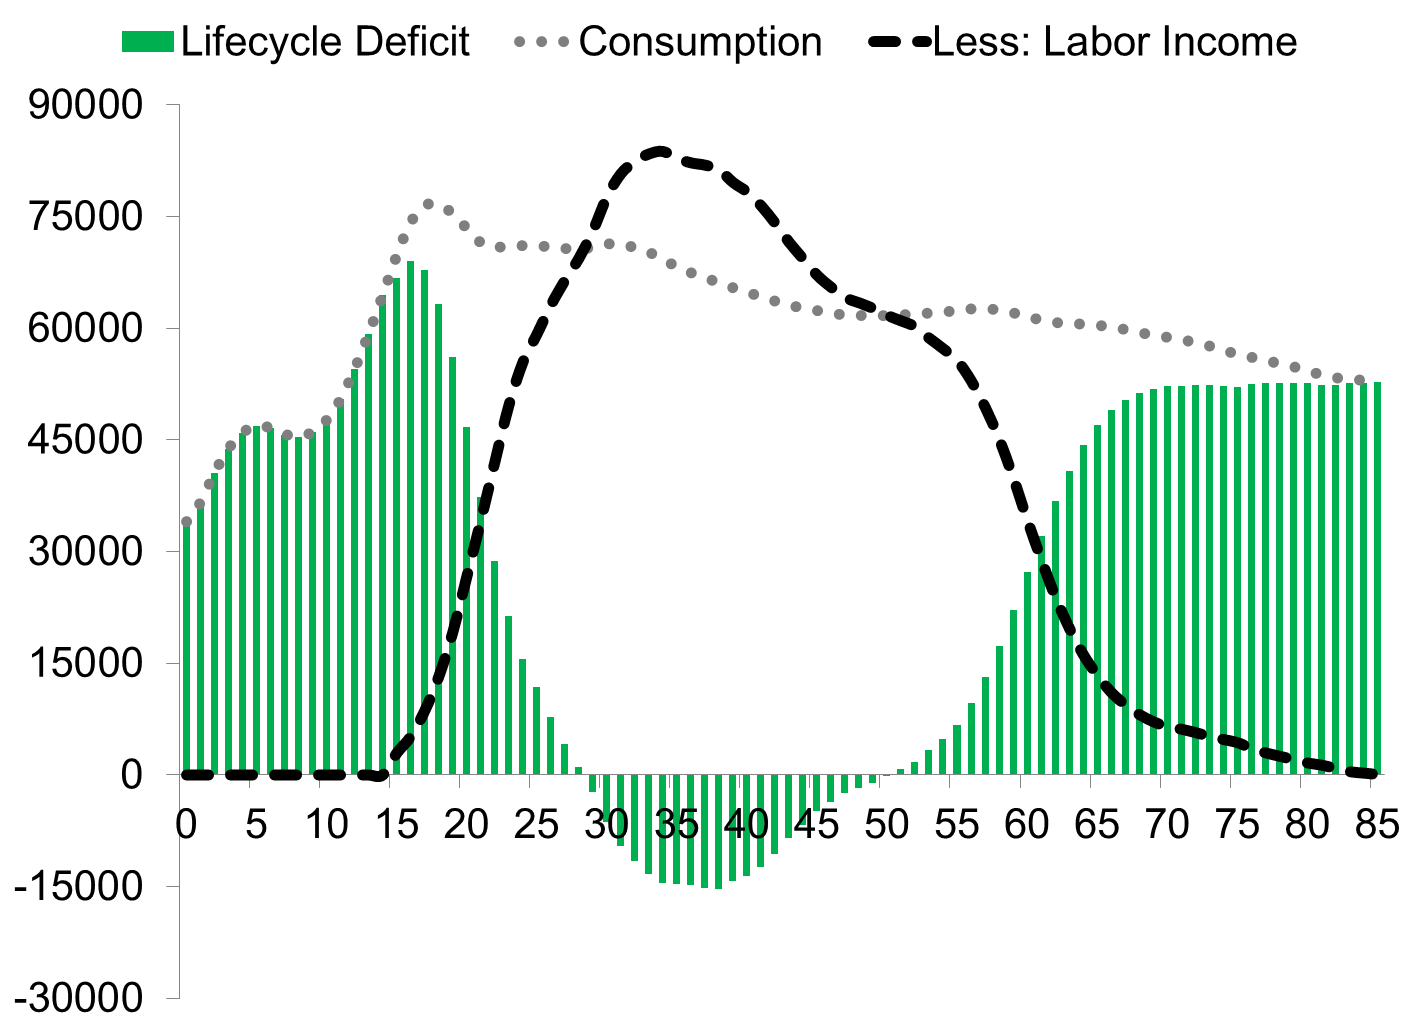
Figure 1: Consumption, labour income, and life-cycle deficit per capita, MDL
Source: NTA
The life-cycle deficit is financed by public and private transfers and asset reallocations. In Moldova, at early ages, up to 19 years, the deficit is mainly financed by private transfers (60.3%) and public transfers (26.1%). At early ages, the life-cycle deficit is mainly determined by the consumption of education services. At older ages, after the life-cycle surplus ends, the deficit is mainly financed by public transfers (55.9%) and by asset reallocations (34.1%).
Also, based on the author's calculations, it was found that the ratio between effective workers and consumers reached the maximum level of about 0.565 in 2016-Since then, the support ratio decreased and will reach a 0.491 value in 2040. The decrease in support ratio indicates that the number of effective workers reduces faster than the number of effective consumers. This trend will be reflected in the evolution of the first demographic dividend. Since 2017, the indicator has had negative values. The minimum value will be reached in 2027 (-0.88%), and from 2028 the negative values of the dividend will decrease (Figure 2).
However, there are alternative approaches related to the demographic dividend. According to one of the approaches, the demographic dividend occurs when the share of the working-age population (economically productive people) is higher than the share of the non-working-age population: children and the elderly (the dependent population). From a statistical point of view, the dividend appears when economically productive people represent 55% or more of the population. Gagauz and Tabac (2017) used this approach and showed that the share of the working-age population in Moldova will be higher than 55% by 2040.
However, between 2015 and 2029, the indicator will decrease from 71.2 to 63.1%. In addition, after 2030, the share of the productive population will fluctuate slightly between 63% and 64%. As a result, it can be concluded that population dynamics will have a favourable impact on economic development, although this influence will diminish over time. The calculation of the demographic dividend by combining demographic and economic indicators has some advantages in comparison with the strictly demographic estimation of the dividend. The estimation based on a mix of economic and demographic variables allows for analysing of the effects of public policies. Thus, the increase in the retirement age will lead to a rise in the number of effective workers. This change will be captured in the dividend calculated by mixing demographic and economic variables but will not be found in the approach that relied only on demographic indicators.
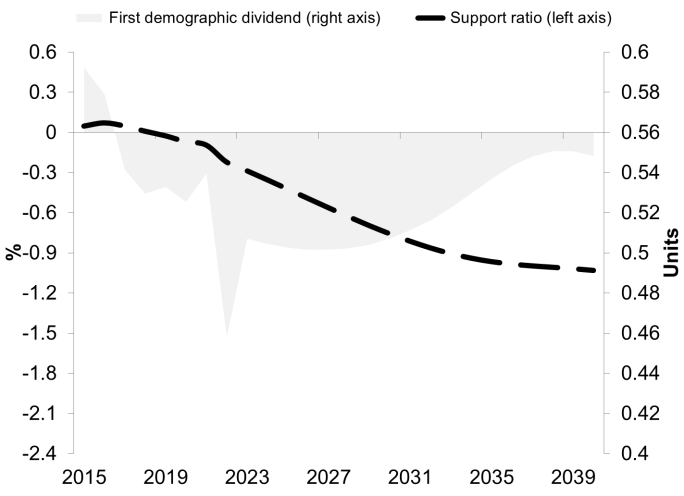
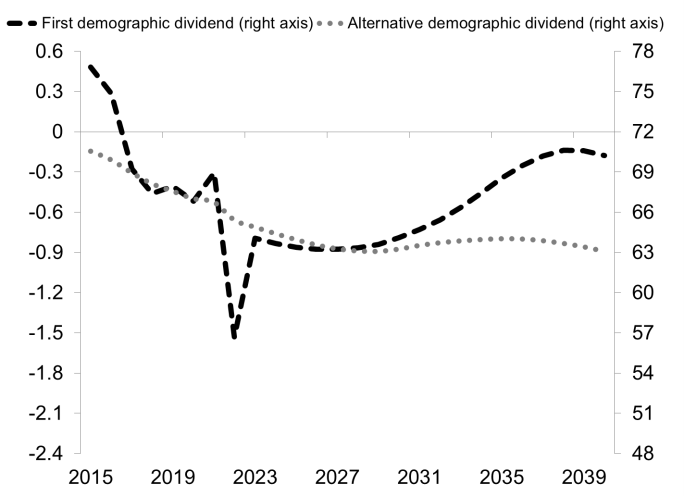
Figure 2. Demographic dividends, % and support ratio, units
Source: calculated based on CDR and NBS data
Population ageing could provide opportunities for economic growth. The second demographic dividend determines the positive influence. The increase in pension wealth is one of the fundamental factors that lead to the emergence of the second demographic dividend. In turn, the demand for pension wealth is determined by the longitudinal support rate. In 2015, the longitudinal support rate was 0.27. This fact means that for persons aged 45 years and over, only 27 years out of 100 years of consumption are covered by labour income, and the remaining 73 years should be covered from other sources: transfers from the state or from young generations, or the assets accumulated during the life. Between 2015 and 2039, the longitudinal support rate will decrease from 0.27 to 0.24 (Figure 3). This evolution shows that in 2039 the labour income of the elderly will cover a smaller part of their consumption compared to 2015. Thus, only 24 years out of 100 years of consumption will be covered by labour income, while in the remaining 76 years, consumption should be covered by other sources.
An increase in pension wealth will accompany the decrease in the longitudinal support ratio. Between 2015 and 2039, pension wealth relative to labour income will increase from 6.5 to 14.4. Hence, the economy will benefit from the second demographic dividend. It reached a maximum level of around 2.7% in 2020. Afterwards, the second dividend will decrease; however, it will be higher than 0.9% during the 2015-2039 period (Figure 3).
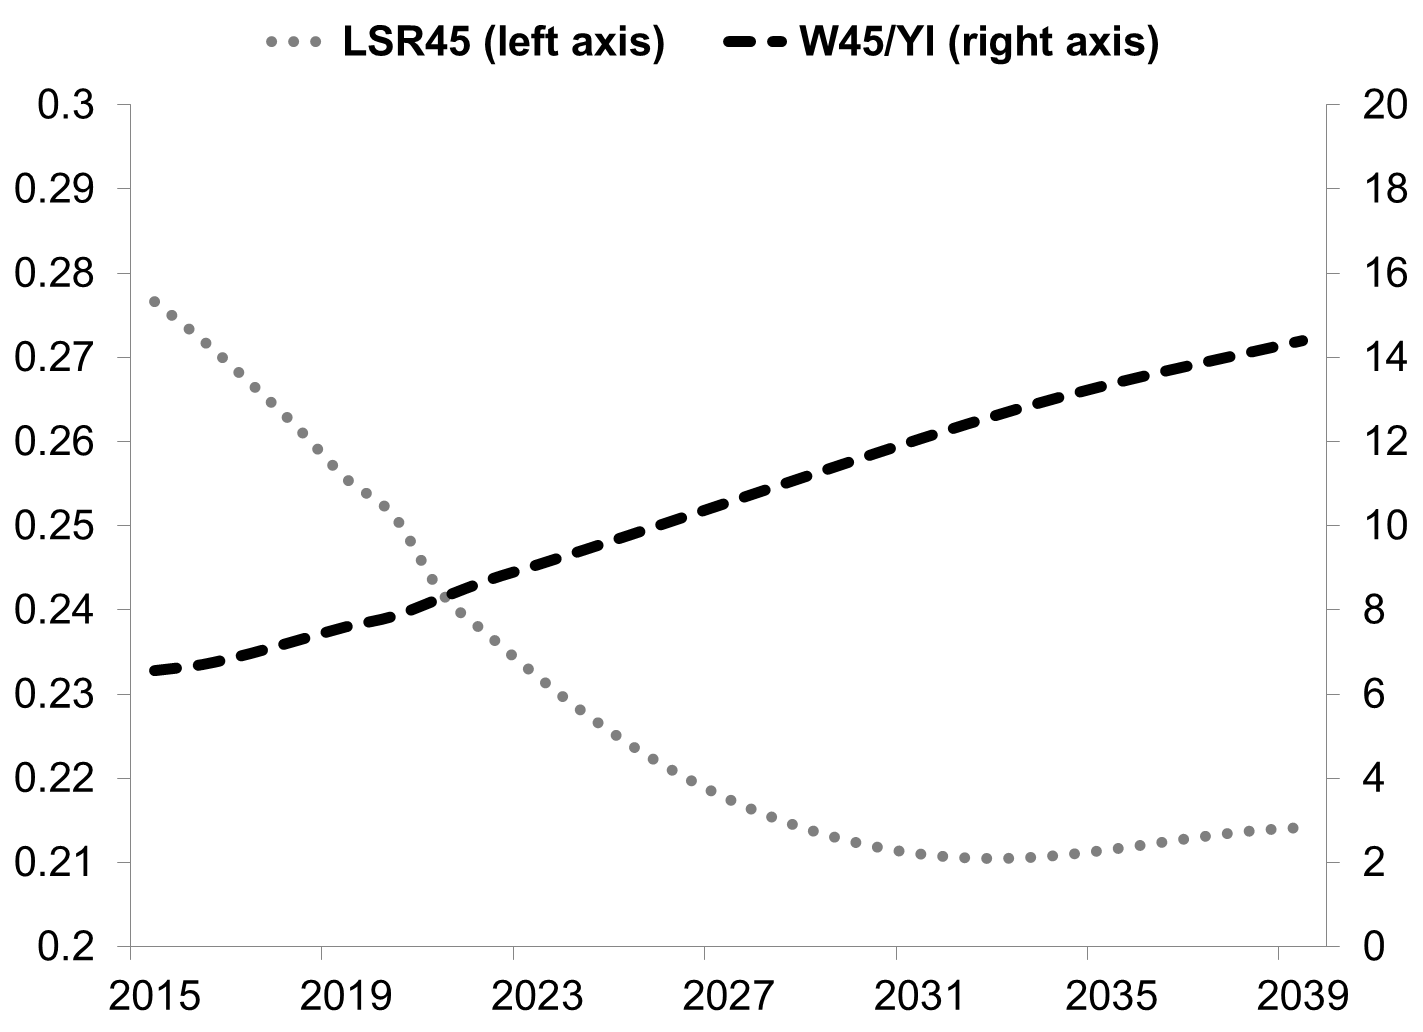
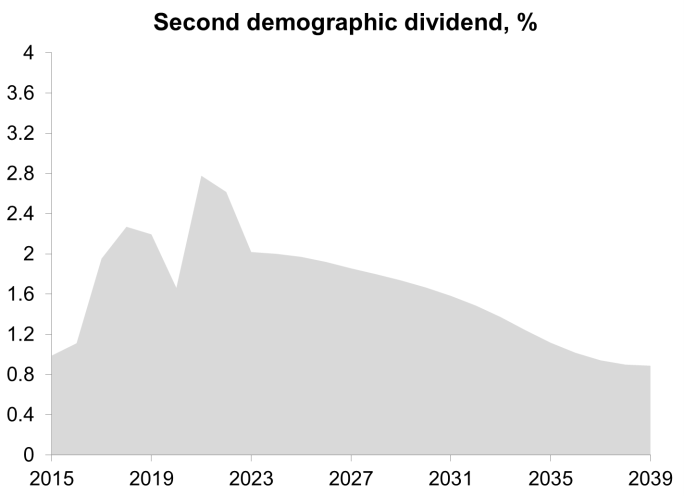
Figure 3. Longitudinal support ratio (LSR 45), pension wealth (W45) and second demographic dividend
Source: calculated based on CDR and NBS data
In the graphic representation of demographic dividends for Moldova, some fluctuations can be distinguished (prominent extremes in 2022). Despite these oscillations, the trends are very well observed. In specialised literature, the figures for demographic dividends are not smooth, but there are discernible long-term trends (Mason et al. 2017). In fact, analysing demographic dividends is more essential to detect long-term trends.
The analysis of the cumulative effect of both dividends shows that Moldova will have a net positive result. The negative impact associated with the first demographic dividend is outweighed by the positive influence of the second dividend (Figure 4). If the cumulative value of the first demographic dividend is -12.94% (annual average of -0.52%) between 2015 and 2039, the second demographic dividend will amount to 41.09% (annual average of 1 .64%). Consequently, the net aggregate dividend will be 28.14%, representing an annual average of around 1.13%. Thus, the cumulative effect of demographic dividends, on average, will contribute to the increase of GDP per capita by 1.13% per year (considering that all inhabitants of a country are consumers) between 2015 and 2039. In the same period, the total contribution of both dividends to the increase in GDP per capita will exceed slightly 28%.
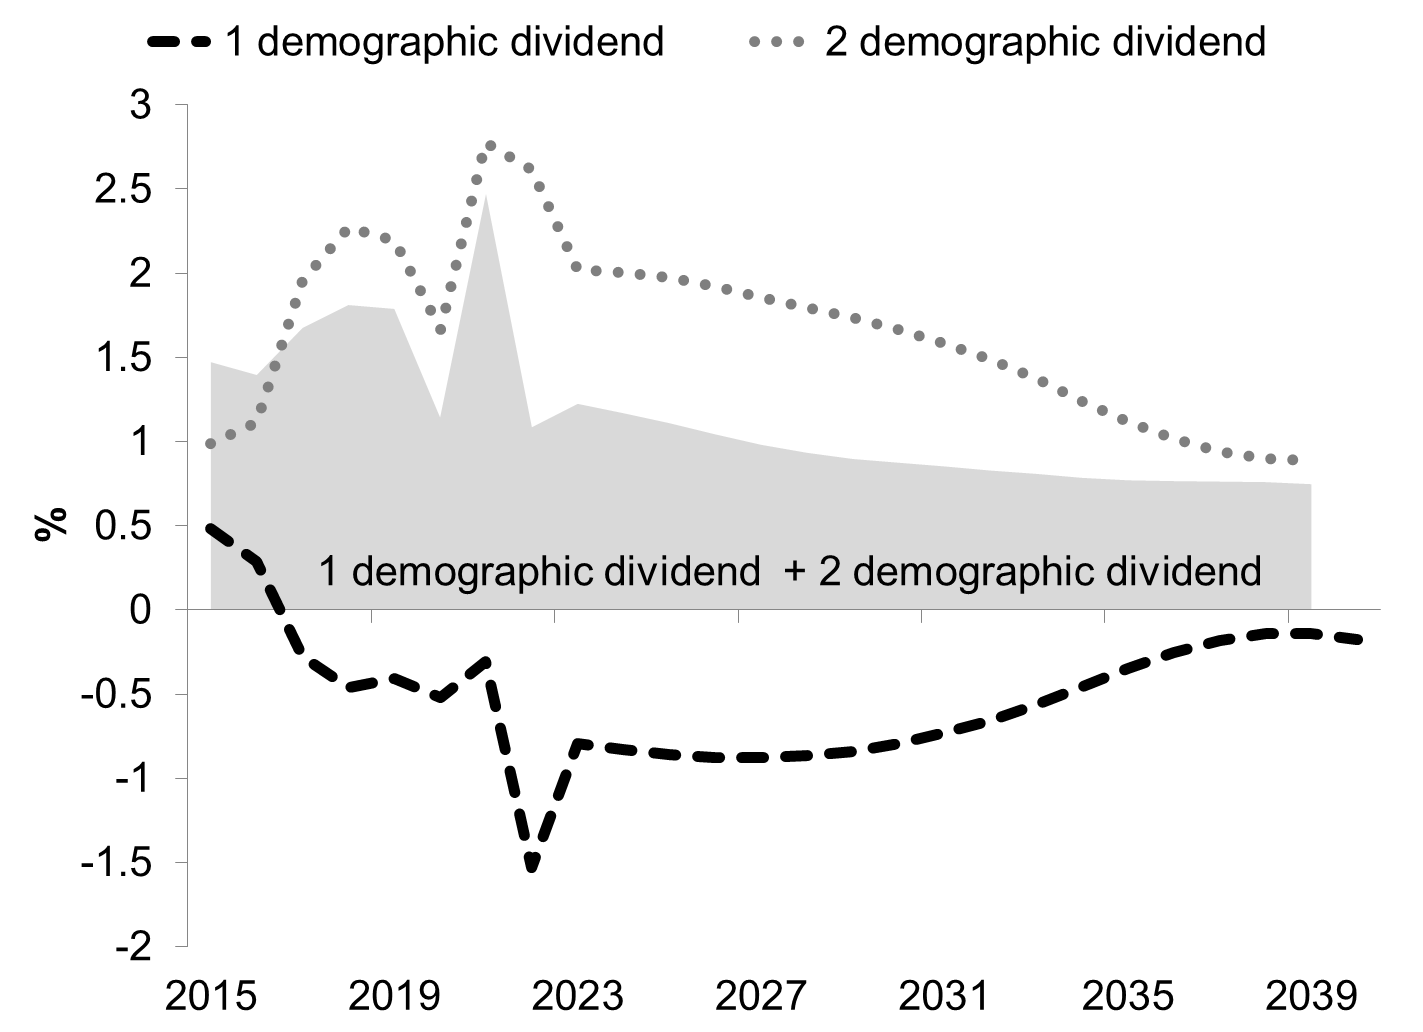
Figure 4. The aggregate effect of the first and second demographic dividends, %
Source: calculated based on CDR and NBS data
The evolutions of the demographic dividends in Moldova correspond to regional trends. The first demographic dividend records negative values in Europe since 2015. However, the harmful effect associated with the first demographic dividend is overcome by the positive influence related to the second demographic dividend (Figure 5).
Figure 5. Demographic dividends in Europe, 2015-2045 annual average, %
Source: Mason, A., Lee, R., Abrigo, M., Lee, S. Support Ratios and Demographic Dividends: Estimates for the World. p. 45.
Calculated based on CDR and NBS data
Note: for Moldova are presented simulations for 2015-2039
Moldova has lost the advantage offered by the first demographic dividend. However, it is an "open window" for the opportunities generated by the second demographic dividend. In the case of efficient public policies, Moldova could reduce the negative influence associated with the loss of the first demographic dividend and strengthen the advantages related to the second demographic dividend.
DISCUSSIONS
The results show that Moldova has already missed the first demographic dividend. Once again is confirmed that entering the stage of the "window of opportunity" does not guarantee that the state will automatically receive economic dividends. For the demographic dividend, obtaining appropriate socio-economic conditions are needed. The increase in the proportion of the working-age population in Moldova coincided with economic decline, political instability, and reduced occupational opportunities. Thus, the "demographic bonus" implementation in Moldova had a crisis character (Barsukov, 2019). The lack of jobs led to mass emigration of the population, especially working-age people. The country's population has decreased by about one million in the last two decades due to emigration (Gagauz et al., 2021). The Moldovan citizens contributed to the development of the economies of other countries, and the demographic dividend was partially returned through migrants' remittances.
The situation is still difficult, and there are no prerequisites for the fullest use of available labour resources. A recent study shows that the low level of labour incomes of the population and the high level of life cycle deficit in Moldova is primarily due to the low level of employment and the unfavourable ratio between the working and non-working people. The size of the economic life cycle deficit (LCD) in 2019 amounted to 67.6 billion lei, 59.1% of total labour income and 32.1% of real GDP (Gagauz &Prohnițchi, 2022).
In the next two decades, the number of producers will decrease faster than that of consumers, although, after 2027, the negative dynamics are expected to moderate. On the other hand, the second demographic dividend can be a window of opportunity. Moreover, because the adverse effects associated with the loss of the first demographic dividend will be outweighed by the positive influences related to the second demographic dividend, the net result will be positive. These evolutions will create opportunities for economic growth.
CONCLUSIONS
To encourage economic growth, public policies should address the influences determined by demographic dividends. It is necessary to facilitate entry to the labour market of young persons. For example, expanding the nursery network would increase the enrolment of children (under three years) in preschool education. As a result, the effective duration of maternity/paternity leaves could reduce, and these actions could allow parents to return or enter to labour market more quickly. In addition, it would extend the possibilities of keeping people with retirement age at work if the elderly want to continue their activity and their health is satisfactory. These measures would increase the labour income of older people and reduce the gap between consumption and labour income. At the same time, the period during which adults are net producers would be extended, and the number of net producers would increase, consequently reducing the effects associated with the loss of the advantages offered by the first demographic dividend. To increase the opportunities generated by the second demographic dividend, it is necessary to diversify the investment opportunities, which would favour the accumulation of assets and, implicitly, would increase the capital stock.
REFERENCES
Ando, A., & Modigliani, F. (1963). The "Life Cycle" Hypothesis of Saving: Aggregate Implications and Tests. American Economic Review 53(1), 55–84.
Barsukov V. N. (2019). From the demographic dividend to population ageing: world trends in the systemwide transition. Economic and Social Changes: Facts, Trends, Forecast, 12(4), 167–182. DOI: https://doi.org/10.15838/esc.2019.4.64.11. (In Russian).
Gagauz, O. (2020). Quo vadis? Declinul populației care nu poate fi stopat. Revista de Filozofie, Sociologie şi Ştiinţe Politice, 3(184), 87-100. https://icjp.asm.md/sites/default/files/publicatii/revista_filosofie_nr_3_184_2020.pdf.
Gagauz, O., Buciuceanu-Vrabie, M., Pahomii, I., Ștîrba, V., Tabac, T., & Grigoraș, E. (2021). Populația Republicii Moldova la 30 de ani de independență: provocări principale și politici necesare. INCE, CCD. DOI: https://doi.org/10.36004/nier.ccd.2021.978-9975-89-248-3
Gagauz O. E., & Prohnițchi V. (2022). National transfer accounts of Moldova 2019: principals of construction and some results. Demographic Review 9(2), 65-80. DOI: https://doi.org/10.17323/demreview.v9i2.16206. (In Russian)
Gagauz, O., & Tabac, T. (2017). Cum corelăm dezvoltarea economică cu cea demografică sau ce este dividendul demografic? Barometrul demographic. http://ccd.ucoz.com/_ld/0/53_Barometru_rom.pdf
Lee, R., & Mason, A. (2006). What Is the Demographic Dividend? Finance and Development, 43(3). https://www.imf.org/external/pubs/ft/fandd/2006/09/basics.htm
Lupușor, A., Popa, A., & Prohnițchi., V. (2017). Demography matters: How population dynamics impacts the economy of the Republic of Moldova? UNFPA, Expert-Grup. https://moldova.unfpa.org/en/publications/demography-matters-how-population-dynamics-impacts-economy-republic-moldova-0
Mason, A. (2005). Demographic transition and demographic dividends in developed and developing countries. https://www.researchgate.net/publication/252403184_Demographic_Transition_and_Demographic_Dividends_in_Developed_and_Developing_Countries
Mason, A., Lee, R., Abrigo, M., & Lee, S. (2017). Support Ratios and Demographic Dividends: Estimates for the World. Technical Paper, 1. United Nations. https://www.un.org/en/development/desa/population/publications/pdf/technical/TP2017-
NBM (2022). National Bank of Moldova August. Presentation of the Inflation Report No.3. https://www.bnm.md/en/content/video-presentation-inflation-report-no-3-august-2022
Ogawa, N., Mansor, N., Lee, S., Abrigo, M., & Aris, T. (2021). Population Aging and the Three Demographic Dividends in Asia. Asian Development Review, 38(1), 32-67. https://doi.org/10.1162/adev_a_00157
UN (2013). United Nations. National Transfer Accounts Manual: Measuring and Analysing the Generational Economy. https://ntaccounts.org/doc/repository/NTA manual 2013.pdf