AGRICULTURAL POLICY DEVELOPMENT IN MOLDOVA OVER ONE DECADE: RECENT ESTIMATES AND AN OUTLOOK TOWARDS EU ACCESSION
DOI: https://doi.org/10.36004/nier.es.2022.2-01
JEL classification: Q1, Q18
UDC: 338.43.02(478)
Thomas Herzfeld, prof. Dr., Leibniz Institute of Agricultural Development in Transition Economies, Germany; Martin-Luther-Universität Halle-Wittenberg, Germany
https://orcid.org/0000-0001-8331-5750 e-mail: [email protected]
Eugenia Lucasenco
National Institute for Economic Research, Republic of Moldova
https://orcid.org/0000-0002-5032-7963 e-mail: [email protected]
Dmitry Zvyagintsev, Policy Officer, FAO Regional Office for Europe and Central Asia
https://orcid.org/0000-0002-3075-962X e-mail: [email protected]
Received 12 September 2022
Accepted for publication 6 December 2022
ACKNOWLEDGEMENTS
This paper represents a synthesis of an analytical report (developed by the authors) prepared during the implementation of an FAO project in Moldova between 2020 and 2021 (TCP/MOL/3701 - Building MARDE Administrative Capacities for the Implementation of Agrifood Products Promotion Policy). The views represent those of the authors and do not necessarily represent the view of the FAO.
Abstract
Public support for the agricultural sector of Moldova represents an essential priority of the bodies entitled to the development and implementation of public policies in the field of agriculture. Given the accelerated attempts to join the European Union, an alignment of the Moldovan agricultural policy to the EU’s Common Agricultural Policy (CAP) and broader EU green infrastructure with Green Deal and Farm to Fork, are receiving an increasing attention. In order to support the policy makers and the experts with input for the EU legal approximation and future EU accession negotiations, this article presents recent estimates of public support for the agricultural sector of the Moldova using the OECD methodology. More specifically, the Producer Support Estimate (PSE) results are presented for eleven products covering the period 2007-2018. Despite increasing budgetary support of agricultural producers from the Government of Moldova, PSE for most commodities is negative. Given the relatively low relevance of trade interventions, the calculated price differentials hint at non-policy-related barriers to price transmission between the border and the farm gate. Potential reasons are discussed, and policy recommendations are developed. Furthermore, the structure of public policies for agriculture and rural areas, approximated by the General Services Support Estimate (GSSE), are presented. The comparison with the current CAP reveals that the structure of instruments differs substantially. Funding for the current Moldovan agricultural policy is heavily concentrated on investment support and the inspection and control system. Although the CAP might be further reformed until Moldova joins the EU, environmental and rural development policy objectives will remain paramount within the EU, and the relevant ministries should start to develop suitable joint strategies.
Keywords: Agricultural policy, Producer Support Estimate, General Services Support Estimate, Moldova, EU accession, EU’s Common Agricultural Policy
Abstract
Sprijinul public pentru sectorul agricol în Republica Moldova reprezintă o prioritate esențială a instituțiilor abilitate cu elaborarea şi implementarea politicilor publice în domeniul agriculturii. Având în vedere încercările accelerate de aderare la Uniunea Europeană, va primi o atenție din ce în ce mai mare alinierea politicii agricole a Moldovei la Politica Agricolă Comună (PAC) a UE și o infrastructură ecologică mai largă a UE marcată în Pactul Verde European și Strategia de la fermă la furculiță. Pentru a sprijini factorii de decizie politici și experții cu contribuții pentru apropierea juridică la UE și viitoarele negocieri de aderare la UE, acest articol prezintă estimări recente ale sprijinului public pentru sectorul agricol al Moldovei folosind metodologia OCDE. Mai precis, rezultatele Estimarea Sprijinului Producătorului (PSE) vor fi prezentate pentru unsprezece produse care acoperă perioada 2007-2018. În pofida creșterii sprijinului bugetar al producătorilor agricoli din partea Guvernului Moldovei, PSE pentru majoritatea mărfurilor este negativ. Având în vedere relevanța relativ scăzută a intervențiilor comerciale, diferențele de preț calculate sugerează bariere nelegate de politici în calea transmiterii prețurilor la hotar și de producător. Motivele potențiale sunt discutate și sunt elaborate recomandări de politici. De asemenea, este prezentată structura politicilor publice pentru agricultură și zonele rurale, aproximată prin Estimarea Sprijinului Serviciilor Generale (GSSE). Comparația cu PAC actuală arată că structura instrumentelor diferă substanțial. Finanțarea politicii agricole actuale a Moldovei este concentrată în mare măsură pe sprijinirea investițiilor și pe sistemul de inspecție și control. Deși PAC ar putea fi reformată în continuare până la aderarea Moldovei la UE, obiectivele politicii de mediu și dezvoltare rurală vor rămâne primordiale în cadrul UE, iar ministerele competente ar trebui să înceapă să elaboreze strategii comune adecvate.
Cuvinte cheie: Politică agricolă, Estimarea sprijinului pentru producători, Estimarea sprijinului pentru servicii generale, Moldova, Aderarea la UE, Politica agricolă comună a UE
Абстракт
Государственная поддержка сельскохозяйственного сектора Молдовы является одним из основных приоритетов органов, уполномоченных на разработку и реализацию государственной политики в области сельского хозяйства. Учитывая ускорение попыток присоединения к Европейскому союзу, все большее внимание уделяется согласованию сельскохозяйственной политики Молдовы с Единой сельскохозяйственной политикой ЕС (ЕСП) и более широкой зеленой инфраструктурой ЕС − «Зеленым соглашением» и Стратегией «От фермы к столу». В целях поддержки политиков и экспертов, внесших свой вклад в правовое сближение с ЕС и будущие переговоры о вступлении в ЕС, в этой статье представлены последние оценки государственной поддержки сельскохозяйственного сектора Молдовы с использованием методологии ОЭСР. В частности, результаты оценки поддержки производителей (PSE) представлены для одиннадцати продуктов за период 2007–2018 гг. Несмотря на усиление бюджетной поддержки сельхозпроизводителей со стороны правительства Молдовы, PSE по большинству товаров отрицательный. Учитывая относительно низкую значимость торговых вмешательств, рассчитанные различия в ценах указывают на не связанные с политикой барьеры для передачи цен между границей и воротами фермы. В статье обсуждаются возможные причины и представлены рекомендации по совершенствованию политики в данной сфере. Кроме того, представлена структура государственной политики для сельского хозяйства и сельских районов, аппроксимированная оценкой поддержки общих служб (GSSE). Сравнение с действующей ЕСП показывает, что структура инструментов существенно отличается. Финансирование текущей сельскохозяйственной политики Молдовы в значительной степени сосредоточено на поддержке инвестиций и системе инспекции и контроля. Хотя ЕСП может быть подвергнут дальнейшему реформированию до присоединения Молдовы к ЕС, цели политики в области окружающей среды и развития сельских районов останутся первостепенными в рамках ЕС. Исходя из этого, соответствующие министерства должны начать разработку необходимых совместных стратегий.
Ключевые слова: сельскохозяйственная политика, оценка поддержки производителей, оценка поддержки общих служб, Молдова, вступление в ЕС, Единая сельскохозяйственная политика ЕС.
INTRODUCTION
With more than 1.5 million people, i.e., 57 % of the total population, living in rural areas, Moldova belongs to the less urbanized countries of Europe (National Bureau of Statistics, 2022). The agricultural sector contributes 11% of the Gross Value Added (GVA)1, employs 21% of the total labor force (2020), and, thus, still represents an important economic activity. However, the ratio between GVA and the agricultural labor force points to low agricultural sector productivity. In the medium term, the sector might face particular adjustment requirements to benefit from EU integration. Agricultural policy will be challenged to align closer to the EU’s Common Agricultural Policy (CAP). In particular, labor productivity will have to increase by either further reducing agricultural employment or increasing the value of agricultural products. Agricultural policies can play an influential role in both processes.
This contribution aims at describing the development of the agricultural policy of Moldova over the most recent decade in a consistent way. Furthermore, it compares the typology of policy instruments between Moldova and the CAP. More specifically, key indicators of the OECD-family of support estimates will be used. We rely on the Producer Support Estimate (PSE) for direct support to agricultural producers. For quasi-public goods for the agricultural sector in general, we use the General Services Support Estimate (GSSE).
The methodological foundation to quantify agricultural policies dates back to studies by Josling (Josling, 1973) and Krueger et al. (Krueger et al. 1988) and was later expanded and further developed by OECD. The application of the PSE methodology by OECD (OECD, 2016) provides a standardized quantitative method of measurement of support to the agricultural sector. Similar initiatives are the Monitoring and Analysing Food and Agricultural Policies (MAFAP) programme by FAO (MAFAP 2015) and a World Bank-initiated project coordinated by Anderson (Anderson et al., 2008, Anderson et al., 2009, Anderson and Nelgen, 2009) with a focus on a broader set of countries including several developing countries. The quantitative effects of agricultural policy in Moldova and other selected CIS countries using Nominal Protection Rate (NPR) coefficients were explored by Volk (Volk et al. 2015) in their report on the CIS trade potential. NPR is a simplified methodology used to ensure comparability between CIS countries. At the same time, in 2015, the first attempt to expand the approach by calculating PSE and other OECD coefficients for 2006 – 2014 was made by Shik (Shik 2015, Shik et al., 2016) and Lucasenco (Lucasenco, 2017). This contribution builds upon these studies and covers more recent years.
THE POLICY FRAMEWORK
Moldovan government’s agricultural policy objectives are expressed in the most recent strategy - “National Strategy for Agriculture and Rural Development for 2014-2020” (GRM, 2014), the new sectoral Strategy still being in the process of development. Starting in 2017, all subsidies for agricultural producers have been merged under the National Fund for Development of Agriculture and Rural Environment (NFDARE). The NFDARE is characterized by three priorities that reflect the objectives of Moldova’s agricultural policy: “Increasing the competitiveness of the agri-food sector through restructuring and modernization” (Priority I), “Management of sustainable development of natural resources” (Priority II), and “Increasing investments in physical infrastructure and rural services” (Priority III). Under these priorities, five measures provide a further structure:
Measure 1: Investments in agricultural holdings for restructuring and harmonization to European Union standards
Measure 2: Investments in processing and marketing of agricultural products
Measure 3: Preparation for the implementation of actions related to the environment and rural area
Measure 4: Improvement and development of rural infrastructure
Measure 5: Consultancy and training services (GRM, 2017).
The total monetary amount spent in the form of subsidies to agricultural producers and processors varies from year to year. In 2018, it amounted to 968 million Moldovan Lei (MDL) (ca. 49 million Euros), which accounts for ca. 68 % of the ministry’s budget line. The relative importance of the different measures changes from year to year; some measures have been longer in place than others. Almost all instruments represent investment support and will be distributed after the investment takes place. Thus, support is only accessible to farms that have sufficient financial means or access to credit markets.
Additionally, during the period covered by this analysis, funds of the Ministry of Agriculture have been allocated to research in the agricultural sector, the extension service (in the period 2013-2016), plant and animal disease control and food safety, as well as animal identification and traceability system. All of these expenditures are not part of the NFDARE.
The implementation of the different support programs has been delegated to the Agency of Interventions and Payments in Agriculture (AIPA) since 2010. The agency’s primary functions relate to ensuring the correct and legal implementation of the management of the funds allocated to support agricultural producers, examining the applications and materials submitted by the applicants and their eligibility, as well as operating the internal control system (GRM, 2010).
DATA SOURCES AND USED METHODS
The OECD support estimates aim at establishing an objective and consistent measure of policy-induced incentives and transfers. The observed market conditions are compared with a benchmark or non-policy situation. In particular, distortions directly related to policy instruments such as tariffs or non-tariff trade barriers could be approximated by comparing producers’ output prices with a hypothetical non-distorted price level. The ratio of both values is known as Nominal Protection Rate (NPR). Similarly, a comparison of input prices could quantify distortions in input markets. Suppose the difference between market and reference prices is positive. In that case, policy causes benefits to producers in output markets. If negative – policy leads to implicit taxation of the farmers via outputs (Shik, 2015).
Besides the price-related distortions, the methodology aims at classifying all budgetary transfers flowing into the agricultural sector. Payments are classified as whether they are linked to current or historical production levels, area farmed or animals kept, and whether they require production. All those payments favoring individual producers are added to the price support and form the so-called Producer Support Estimate (PSE). All payments serving public-good type support such as rural infrastructure, education and training, or public food safety are categorized as General Services Support Estimate (GSSE).
The structure of policy instruments, directly and indirectly, affecting the agricultural sector of Moldova is closer to other European transition countries than the classical developing countries of the 1980s. State trading monopolies, dual exchange rates, or other measures drawing resources from the agricultural sector to subsidize urban consumers and non-agricultural sectors are largely absent. In particular, besides an average tariff rate of 11.2% for agricultural products in general (International Trade Administration, 2022) and import quotas for selected products (sugar), no other border measures were notified at the World Trade Organization (WTO, 2007-2018).2 Although the level of direct budgetary transfers to agricultural producers is much lower than the European Union, the OECD methodology is appropriate to quantify the size of political support to agriculture.
The share of the 11 selected products (wheat, sunflower, maize, pork, poultry, milk, grapes, beef, eggs, potatoes, and sugar beet) in the total value of production varies between 65% in 2015 to 92% in 2012, with an average value of 80% during the analyzed period (see Table 1). As sugar beets and fresh milk are not internationally traded, conversions of prices into traded commodities (i.e., white sugar, butter and skimmed milk powder) have been applied. For the EU, OECD data cover 21 agricultural commodities, which account for 74% of the total value of production. Obviously, any direct comparison of monetary values will suffer from price, quantity, and coverage differences. Therefore, the comparison will be limited to the structural characteristics of the various measures and their variability over time.
Reference prices have been derived from Moldovan external trade statistics conditional upon Moldova’s net trade status. As shown in Table 1, Moldova has been a net exporter of wheat, maize, sunflower seeds, white sugar, and grapes for almost all years. Concerning potatoes, beef, pork, and poultry, the country has been predominantly a net importer. The net trade position changes more frequently for dairy products, such as butter and skimmed milk powder. Unit values represent an average price at the border. For net exports, export unit values (i.e., an approximation of free-on-board (fob)-prices), and for net imported commodities, import unit values (i.e., an approximation of cost, insurance, freight (cif)-prices) have been calculated. Weighted averages have been calculated for more differentiated products such as beef, pork, poultry, and dairy products. This approach deviates from OECD, which uses international reference prices for specific qualities at particular locations (e.g., Gulf of Mexico, Rouen, Black Sea). However, varying locations would increase the uncertainty due to missing information on transport costs and quality differences between Moldovan and international markets. A further deviation from the OECD methodology is the treatment of reference prices that exceed domestic prices for net exported commodities. If no policy instruments hamper exports, OECD assigns the negative price difference to zero.
The main sources of information related to farm-gate prices, production, and output are Annual reports and the database of the National Bureau of Statistics. Reports of the Agency of Intervention and Payments in Agriculture, of the Ministry of Finance on budget execution, and UN Comtrade database (UCD, 2020) represent other information sources.
Table 1: Major commodities covered by analysis (2007-2018)
Commodity |
Share in GVA 2018 |
Net exporter in … years |
Net importer in … years |
Average farm gate price (MDL/t) |
Average reference price (MDL/t) |
Wheat |
8.9 |
12 |
0 |
1,9873 |
2,621 |
Maize |
14.5 |
10 |
2 |
2,238 |
2,493 |
Sunflower |
12.2 |
12 |
0 |
4,675 |
6,159 |
White sugar |
1.4 |
10 |
2 |
4,049 |
4,382 |
Potatoes |
2.9 |
1 |
11 |
2,240 |
2,808 |
Grapes |
1.3 |
12 |
0 |
3,420 |
6,154 |
Milk |
1.5 |
|
|
4,685 |
2,616 |
Butter |
|
6 |
6 |
|
54,640 |
Skimmed milk powder (SMP) |
|
5 |
7 |
|
35,107 |
Beef |
6.9 |
2 |
10 |
37,991 |
46,728 |
Pork |
11.0 |
0 |
12 |
32,144 |
30,839 |
Poultry |
7.0 |
0 |
12 |
29,694 |
14,217 |
Eggs |
2.0 |
2 |
10 |
15,322 |
5,815 |
Source: National Bureau of Statistics (2020), UN Comtrade (2020)
Note: Standard deviations in parentheses.
THE RESULTS OF RESEARCH AND DISCUSSIONS
The following results present two different PSE estimates for Moldova. The first, called ‘all’, includes all prices. The second, called ‘OECD’, neglects negative price differences between domestic and reference prices for net exported commodities. The data for the EU is directly taken from the OECD. Similarly, the classification of transfers follows the OECD approach.
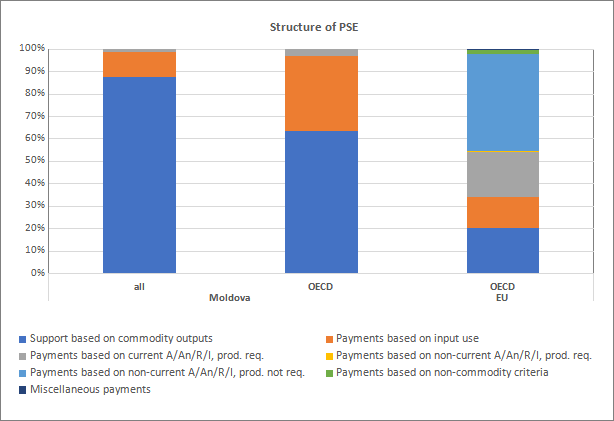
Figure 1 presents a comparison of the structure of the PSE over the period 2007-2018. In Moldova, the major components of the PSE are the market price support (MPS) and the different farm investment subsidies classified here as payments based on input use. Independent of the way of calculating MPS, the transfers from the government budget to farms account for a smaller share. The EU’s PSE is much more complex and reflects the various instruments in place. The decoupled direct payment occupies the largest share (43%). Still existing output-based support and transfers requiring production account for 20% each. Payments based on input use are relatively less important in the current CAP (14%).

Figure 1: Comparison of the structure of PSE between Moldova and the EU
Source: Own computation based on National Bureau of Statistics (2020), UN Comtrade (2020); OECD (2022)
As measured by the PSE, the level of support is substantially lower in Moldova compared to the EU. Considering all commodities, the percentage PSE, expressed in relation to the value of the agricultural production, amounts to -13.5% on average. Neglecting the net exported commodities results in a percentage PSE of 6.2%. On average, budgetary support alone accounts for 2.3% of the total value of agricultural production. For the EU, the percentage PSE has been 23.2% over the period 2007-18. Furthermore, the PSE is much more volatile for Moldova than for the EU. This is driven by two factors: changes in the MPS and changing budgetary transfers. The latter varies between 242 mill. MDL4 (2012) and 954 mill. MDL5 (2018). The coefficient of variation is almost six times higher for Moldova (0.38) compared to the EU (0.06), which is only one indication of a more unstable agricultural policy environment in Moldova in the past.
A closer look at commodity-level is required to understand the strong differences within the MPS for Moldova. Figure 2 displays the MPS by commodities and years for all commodities (left panel) and only net imported commodities (right panel). Obviously, wheat, sunflower seeds and grapes which have been net exports in all years are missing in the right panel. Price differences seem to have increased in both directions over time. Thus, the data suggest that domestic producer prices for, in particular, poultry and dairy products exceeded the reference border prices and prices for wheat, pork, grapes, and eggs have been lower than border reference prices. In the case of grapes, producer prices are lower than Turkish farm gate prices and export prices are only half or even less than half of the export prices of South Africa and Chile. A closer look at the tariff rate schedule underlines the conclusion for poultry meat, where import tariff rates range between 15% and 20% + 100 EUR/ton. Despite tariffs and import quotas for sugar, MPS for this commodity was negative in two years when Moldova was a net sugar importer. This observation suggests that other supply chain actors than farmers benefit from border protection. However, the estimate for eggs has to be interpreted with caution as values before 2015 most likely include eggs for incubation. UN Comtrade data differentiate trade in eggs at a six-digit level only from 2015 onwards. In the case of beef, the switching sign of MPS from negative to positive in 2015, 2016, and 2018 is surprising. As Moldova was a net beef exporter for most of all years, this result indicates either segmentation of markets or a strong competitive advantage of Moldovan beef besides price.
One common non-policy-driven reason for price differences relates to different qualities traded domestically and internationally. For instance, in the case of poultry, more than 90% of imports took place in the category of Poultry cuts and offal, frozen (020714). Thus, the positive MPS might partially also reflect a segmentation in imports of relatively cheap parts and domestic production of higher quality/ fresh poultry meat. Although quality differences might explain some part of the price wedge, the year-to-year variation also hints at other impediments to price transmission between the farm gate and border. Anecdotal evidence suggests a limited competition and existence of market power within the supply chain post-farm gate. Further research is needed to understand the underlying reasons.
|
Figure 2: MPS by commodities and years
Source: Own computation based on National Bureau of Statistics (2020), UN Comtrade (2020)
If producer prices below border prices are transmitted to consumer markets, negative market price support in recent years would imply lower costs of consumers’ diets. Furthermore, comparatively low producer prices represent a potentially higher competitiveness of Moldovan agricultural producers on export markets.
In the case of the EU, MPS during the period analyzed here has been still high for beef and veal and poultry meat. For six commodities (durum wheat, oats, soybeans, sunflower, rapeseed, and tomatoes) MPS was or has been assigned to zero in all years.
As mentioned above, the transfers from the Ministry’s budget can be categorized in transfers to individual farms and funding for quasi-public goods. Whereas the first type of budgetary expenditures is part of the PSE, the second type constitutes the GSSE. Figure 3 illustrates the funding allocation and development over time. A remarkable increase of expenditures took place in 2014, but was not maintained continuously in the following years. Except in 2015, the majority of funds have been allocated to farm-specific transfers. In 2016 and 2018, less than a quarter of the funding was allocated to GSSE-categories. However, this share is always higher compared to the EU countries where only between 13% and 18% of the budgetary transfers are categorized as GSSE.
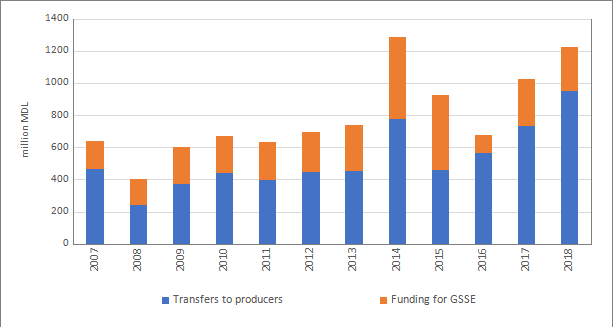
Figure 3: Classification of budgetary support
Source: calculations based on Agency for Intervention and Payments in Agriculture (2010-2018), World Trade Organization (2007-2018), Ministry of Finance of the Republic of Moldova (2007- 2018) and Parliament of the Republic of Moldova (2009)
Having a closer look into the specific measures representing direct transfers to farms (see Figure 4), the financially most important measures focus on stimulating investments for the purchase of agricultural machinery and equipment, production of vegetables and fruits on protected land, establishment, modernization and deforestation of perennial plantations, and procurement of irrigation equipment. These measures have been classified according to the OECD approach as support to fixed capital formation (B2). Coupled support (C), either based on income or on area, and support of variable input use (B1) have been important before 2011. But with the exception of payments for organic agriculture and energy subsidies for irrigation, they have been phased out in recent years.
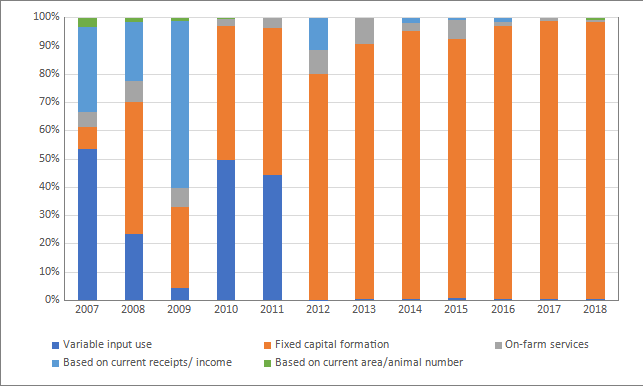
Figure 4: Breakdown of budgetary transfers to producers by implementation criteria (in %)
Source: calculations based on Agency for Intervention and Payments in Agriculture (2010-2018), World Trade Organization (2007-2018), Ministry of Finance of the Republic of Moldova (2007- 2018) and Parliament of the Republic of Moldova (2008)
Support for general services (GSSE) shows structural differences between Moldova and the EU (see Figure 5). While the share of measures classified as Agricultural knowledge and information system is twice as large in the EU, the Moldovan expenditures exhibit a strong focus on the Inspection and control category, accounting for almost half of the quasi-public goods expenditures. The majority of this position serves as financing of measures of plant and animal disease control and protection, securing food safety and quality, as well as plant testing. The funding for the animal identification and traceability system, a prerequisite for access to EU markets and funding, either didn’t receive any funding since 2014 or it has been submerged under a different heading (see Figure 6). Funding for the development and maintenance of infrastructure and public stockholding has been declining during the analysis period. Obviously, strict compliance with the EU’s food safety standards is a prerequisite for market access and an important field of public action to increase Moldovan agriculture’s competitiveness in markets of higher-income countries. However, the administration of the inspection and control system should be designed efficiently with minimized risks of corruption. Here we assume that these imperfections are absent and that improving food safety standards and meeting export market requirements is beneficial for the sector in general. Activities related to marketing and promotion are left for producers’ concern and receive low support from the budget. Generally, we have to conclude that also GSSE-type expenditures exhibit a relatively high variability over the period analyzed here.
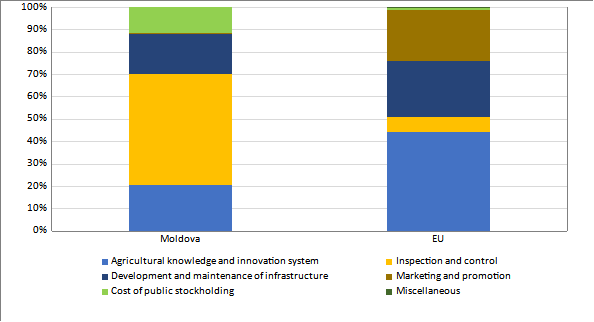
Figure 5: Structure of GSSE
Source: calculations based on Agency for Intervention and Payments in Agriculture (2010-2018), World Trade Organization (2007-2018), Ministry of Finance of the Republic of Moldova (2007- 2018) and Parliament of the Republic of Moldova (2008)
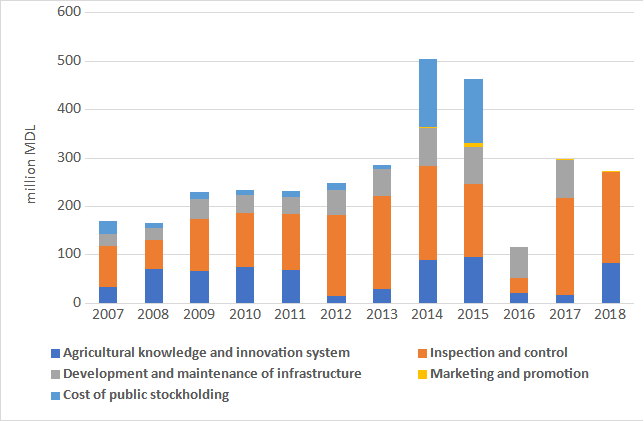
Figure 6: Development of GSSE-type expenditures for Moldova
Source: calculations based on Agency for Intervention and Payments in Agriculture (2010-2018), World Trade Organization (2007-2018), Ministry of Finance of the Republic of Moldova (2007- 2018) and Parliament of the Republic of Moldova (2008)
In Moldova, the share of GSSE in budgetary support in recent years is 25% (2017 – 2018). Although not directly comparable, this share is below the share of GSSE in Total Support Estimate for other countries, such as Brazil (38%, 2017-2019), Canada (30%, 2017-2019), Australia (55%, 2017-2019), or South Africa (27%, 2017-2019). On the other side, it is 13% in Israel, 10.3% for the EU, and 4.7% in Norway (OECD, 2022). One possible reason for the emphasis of GSSE on inspection and control might be the country’s proximity to the EU market and policy focus to harmonize with the EU in food safety. But there is also a transitional character to develop a sound system that ensures the availability of safe products for consumers and foreign tourists. We are observing a similar emphasis in Kazakhstan, while Russia and Ukraine put a relatively higher priority on expenditures for knowledge and information systems and infrastructure investments. Compared to the EU, budget allocation for these purposes also seems more volatile in Russia, Ukraine, and Kazakhstan. For none of the countries, a clear tendency to increase GSSE-type support is visible.
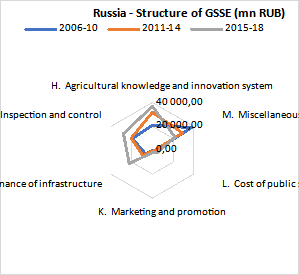
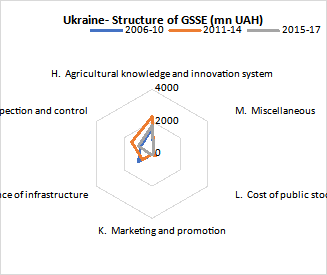
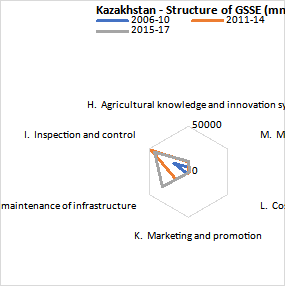
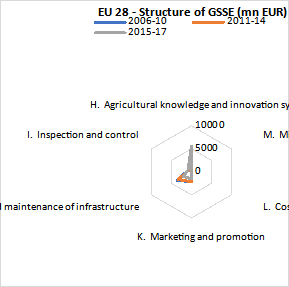
Figure 7: GSSE structure in Russia, Ukraine, Kazakhstan and EU-28
Source: OECD PSE database (2022)
CONCLUSIONS AND RECOMMENDATIONS
The agricultural sector of the Moldova is constantly changing, being subject to transformations as a result of the influence of both endogenous and exogenous factors. An accelerating integration into the EU might increase the pressure to adapt at the level of farms and the level of policy development at the same time. During 2010 – 2018, the vast majority of the allocated subsidies have been intended for investments for the purchase of agricultural equipment, the development of post-harvest infrastructure, and the establishment of multi-annual plantations. All these sub-measures are in line with the current state policy in the field of agriculture, which is focused on enhancing the competitiveness of the sector, but rather focused on the development of the crop sector. At the same time, only a small amount is earmarked for the livestock sector. Moreover, small farmers are less supported in accessing state subsidies, as the current model of post-investment granting of subsidies requires the presence of financial means for investment, which, in many cases, small farmers do not have at the moment of investment is done.
The estimates of output-related supported revealed for several commodities a relatively large and time-varying gap between farm gate and border reference prices. The Producer Support Estimate indicator is low or negative throughout the study period, especially for the cereal crops. During 2007 – 2018, mostly negative MPS values have been identified for wheat, maize, sunflower, potatoes, and grapes. Fluctuating values have been identified for sugar, milk, beef, pork, and eggs and only the poultry subsector has shown high levels of support. The negative results for the analyzed crops are assumed to be explained by the existence of a strong segment on the market, that of intermediaries, low bargaining power of farmers as well as other drivers of market segmentation which prevent a convergence of producer and border prices.
In particular, all cases where trade measures are absent and the gap is negative deserve a more detailed analysis. Although, low prices could help increase Moldovan farmers’ competitiveness on foreign markets, the sector might probably gain more if more emphasis is placed on improving the quality of products, a greater transparency of supply chains and further investments in hard and soft infrastructure. Agricultural and economic policy could help the farming sector relatively efficiently by eliminating or reducing market power of post-farm gate actors in the supply chain. Additionally, enabling farmers’ negotiating positions by establishing market information systems and extension could complement anti-trust actions.
Moldova faces two larger export destinations with rather heterogeneous requirements. The member states of the Eurasian Economic Union (EAEU) are still far from a harmonized food quality system, while EU markets are driven by supermarkets with their own requirements on top of EU food safety regulation. Furthermore, the Russian market has been subject to short-notice trade barriers in the past and might be inaccessible in coming years depending on the further state of the aggression against Ukraine. Thus, a diversified export strategy is important to reduce uncertainties, but is costlier at the same time. Support for specialized services, for instance via farmers’ associations or cooperatives, could help farmers to better understand requirements. Export market information and support for adaptation of food quality requirements of major export markets play a key role here. Similarly, a diversified structure of import origins or substitution of imports by own competitive production represent goals to increase the food system’s resilience.
Obviously, budgetary monitoring does not allow any assessment of the quality of general services. From a welfare economic perspective, public policies which aim at eliminating information asymmetries between producers and consumers, improve human capital of farmers or eliminate external effects and improve the functioning of markets should be pursued (Rausser and Goodhue, 2002). However, real world context might prevent the realization of welfare gains of these policies. The following paragraph discusses some aspects which should be taken into account in an evaluation of the inspection and control system.
Against the background of comparatively high levels of perceived corruption in Moldova, inspection and control services might act as a two-edged sword. Excessive inspections might cause unnecessary costs for producers, disturb them from daily work and even be a source of corruption. Although food safety inspections and compliance with standards are crucial conditions for gaining access to export markets, their reliability might suffer in a corruption-prone environment. Unfortunately, it is challenging to quantify the extent of corrupt practices at a sectoral level. Evidence from international rankings and surveys among non-farm businesses indicate potential risks associated with a non-transparent inspection system. National-level data for Moldova indicate a comparatively high spread of corrupt activities and perceptions of it. According to the Corruption Perceptions Index (CPI) published annually by Transparency International, Moldova ranks 120th out of 180 countries. Its score of 32 is well below other Central and Eastern European countries such as Poland (58), Latvia, Czech Republic or Georgia (all 56) or Romania and Hungary (both 44) (CPI, 2019). More than 20% of firm managers in agribusiness asked in the Business Environment and Enterprise Survey 2013 report corruption as biggest obstacle (Herzfeld et al. 2018). Thus, any efforts to reduce corruption will help to strengthen the reliability of Moldova’s public authorities in the field of food safety and veterinary controls and, most likely, will help farmers in increasing transparency of administrative procedures and decisions.
Farm extension service will support the competitiveness at farm and sectoral level. Adaptation of food quality requirements of major export markets, introducing of new production technologies, quality upgrading, increasing value added on the farm by on-farm processing, and similar actions will increase farms’ position in the market. A reallocation of government budget from subsidies to an improved extension service is in particular recommended for farms who cannot hire private professional consultation and in areas where external effects are high. How to allocate responsibilities; establish incentive-compatible service fees and other questions would require a more detailed analysis of successful examples in other countries. However, an increased competitiveness and a stronger competition have certain consequences for structural change. Less competitive farms will be forced to adjust or exit the sector. Social and regional policies (e.g. pensions, training for jobs outside of agriculture, vitalization of off-farm rural economy) are crucial in accompanying this process.
Given the recent occurrences of adverse weather events, in particular harsh winters and drought, agricultural policy should strengthen farmers’ capabilities of risk management. This policy field yields high synergies with farm extension service. But as weather events might have strong impacts at a regional scale, i.e. several neighboring farms will be affected at the same time, risk management cannot be exclusively delegated to farm managers. Instruments to secure the liquidity of farms might be necessary in addition.
Further EU integration and increasing incomes of Moldovan consumers might allow a diversification of supply channels. Wealthier consumers might stimulate the demand for locally or organically produced food. The development of short value chains would contribute to the development of the agricultural sector but might require more cooperation between producers. Similarly, it is likely that contract farming will gain in importance. While demanding specific product characteristics, processors might provide the necessary technological transfer, production advice, and appropriate inputs. Support for enhanced cooperation between producers and across stages of the value chain requires long-term continuous engagement.
REFERENCES
Agency for Intervention and Payments in Agriculture. (2010-2018). Reports on allocated subsidies for the agricultural sector. www.aipa.gov.md
Anderson, K., & Valdes, A. (2008, September). Distortions to Agricultural Incentives in Latin America and the Caribbean. Agricultural Distortions Working Paper, 70. https://openknowledge.worldbank.org/bitstream/handle/10986/28190/561360NWP0P093110Latin1America10908.txt?sequence=2&isAllowed=y
Anderson, K., & Masters, W.A. (Eds.). (2009). Distortions to agricultural incentives in Africa. World Bank. https://openknowledge.worldbank.org/bitstream/handle/10986/2607/477690PUB0AFR0101OFFICIAL0USE0ONLY1.pdf?sequence=1&isAllowed=y
Anderson, K., Croser, J. L., Nelgen, S., & Valenzuela, E. (2009, March). Global Distortions to Key Agricultural Commodity Markets. Agricultural Distortions Working Paper, 71, 1-59. DOI: https://doi.org/10.22004/ag.econ.48576, https://ageconsearch.umn.edu/record/48576
Food and Agriculture Organization (FAO). Monitoring and Analysing Food and Agricultural Policies (MAFAP). (2015). Methodological pape. Volume I. Analysis of price incentives. FAO. https://www.fao.org/fileadmin/templates/mafap/documents/Methodological_Guidelines/METHODOLOGY_WORKING_PAPER_Vol1_Prices_Incentives.pdf
Guvernul Republicii Moldova. (2010). Hotărâre pentru aprobarea Regulamentului Centrului de Medicină Legală: nr. 60 din 04.02.2010. Monitorul Oficial al Republicii Moldova, 20-22, art. 98. https://www.legis.md/cautare/getResults?doc_id=22194&lang=ro
Guvernul Republicii Moldova. (2014). Hotărâre cu privire la aprobarea Strategiei naţionale de dezvoltare agricolă şi rurală pentru anii 2014-2020: nr. 409 din 04.06.2014. Monitorul Oficial al Republicii Moldova, 152, art. 451. https://www.legis.md/cautare/getResults?doc_id=76222&lang=ro
Guvernul Republicii Moldova. (2017). Hotărâre cu privire la modul de repartizare a mijloacelor Fondului Național de Dezvoltare a Agriculturii și Mediului Rural: nr. 455 din 21.06.2017. Monitorul Oficial al Republicii Moldova, 201-213, art. 537. https://www.legis.md/cautare/getResults?doc_id=114080&lang=ro
Herzfeld, T., Kulyk, I., & Wolz, A. (2018). Is Agribusiness Different? Firm-Level Evidence of Perceived Corruption in Post-Soviet Countries. Eastern European Economics, 56(6), 504-521. DOI: https://doi.org/10.1080/00128775.2018.1503937, https://www.econstor.eu/bitstream/10419/185558/1/Herzfeld_2018_Is_Agribusiness_Different.pdf
International Trade Administration. (2002). Moldova - Country Commercial Guide. https://www.trade.gov/country-commercial-guides/moldova-import-tariffs
Josling, T. (1973). Agricultural protection: Domestic policy and international trade. Supporting Study, C73/LIM/9. FAO.
Krueger, A. O., Schiff, M., & Valdéset, A. (1988). Agricultural Incentives in Developing Countries: Measuring the Effect of Sectoral and Economywide Policies. World Bank Economic Review, 2(3), 255-271. DOI: https://doi.org/10.1093/wber/2.3.255
Lucașenco, E. (2017). Utilizarea metodologiei OECD în evaluarea sprijinului pentru sectorul agrar al Republicii Moldova. In: Alexandri, Cecilia, Gavrilescu, Camelia, Ionel, Iuliana, Kruzslicika, Mihaela, Rusu, Marioara (Coordonatori.), Economie agroalimentara si dezvoltare rurala într-o perspectivă regională (pp. 148-155). Academia Romană, Institutul Național de Cercetări Economice "Costin C. Kiriescu", Institutul de Economie Agrară. Ed. Academiei Romane.
Ministry of Finance of the Republic of Moldova. (2007-2018). Budget reports. www.mf.gov.md.
National Bureau of Statistics. (2020). Statistical databank. https://statbank.statistica.md/
National Bureau of Statistics. (2022). Statistical databank. https://statbank.statistica.md/
Organisation for Economic Co-operation and Development (OECD). (2016). Trade and agriculture directorate. OECD’s Producer Support Estimate and Related Indicators of Agricultural Support: Concepts, Calculations, Interpretation and Use (The PSE Manual). OECD. https://www.oecd.org/agriculture/topics/agricultural-policy-monitoring-and-evaluation/documents/producer-support-estimates-manual.pdf
Parlamentul Republicii Moldova. (2009). Hotărâre de aprobare a Regulamentului privind modul de utilizare a mijloacelor fondului pentru subvenţionarea producătorilor agricoli: nr. 312 din 25.12.2008. Monitorul Oficial al Republicii Moldova, 7-9, art. 18. https://www.legis.md/cautare/getResults?doc_id=11946&lang=ro
Rausser, G. C., & Goodhue, R. E (2002). Public Policy: Its Many Analytical Dimensions. Capter 39. In: Gardner, B. L., & Rausser, G. C. (Eds), Handbook of Agricultural Economics (Vol 2, Part. B, pp. 2057-2102). Elsevier. https://doi.org/10.1016/S1574-0072(02)10026-0
Shik, O. (2015). Agricultural policy analysis in the Republic of Moldova. FAO
Shik, O., Stratan, A., Ignat, A., & Lucaşenco, E. (2016). Evaluation of agricultural support in the Republic of Moldova. In: Agrarian Economy and Rural Development - Realities and perspectives for Romania : international symposium (7th ed., pp. 30-36 ).
Transparency International. (2019). Corruption Perceptions Index 2019: Tabellarische Rangliste. https://www.transparency.de/cpi/cpi-2019/cpi-2019-tabellarische-rangliste/
Volk, T. et al. (2015). Agricultural Policy in the European Union's Eastern Neighbours. In: AGRICISTRADE PROJECT (ed.) Deliverable 2.3. Agricultural Institute of Slovenia.
World Trade Organization (2007-2018). Reports on domestic support. https://www.wto.org/
Annex 1. List of abbreviations
CAP – Common Agricultural Policy
EAEU - Eurasian Economic Union
EU – European Union
GSSE - General Services Support Estimate
GVA - Gross Value Added
MPS - Market Price Support
NFDARE - National Fund for Development of Agriculture and Rural Environment
NPR - Nominal Protection Rate
OECD - Organisation for Economic Co-operation and Development
PSE - Producer Support Estimate
WTO – World Trade Organization